


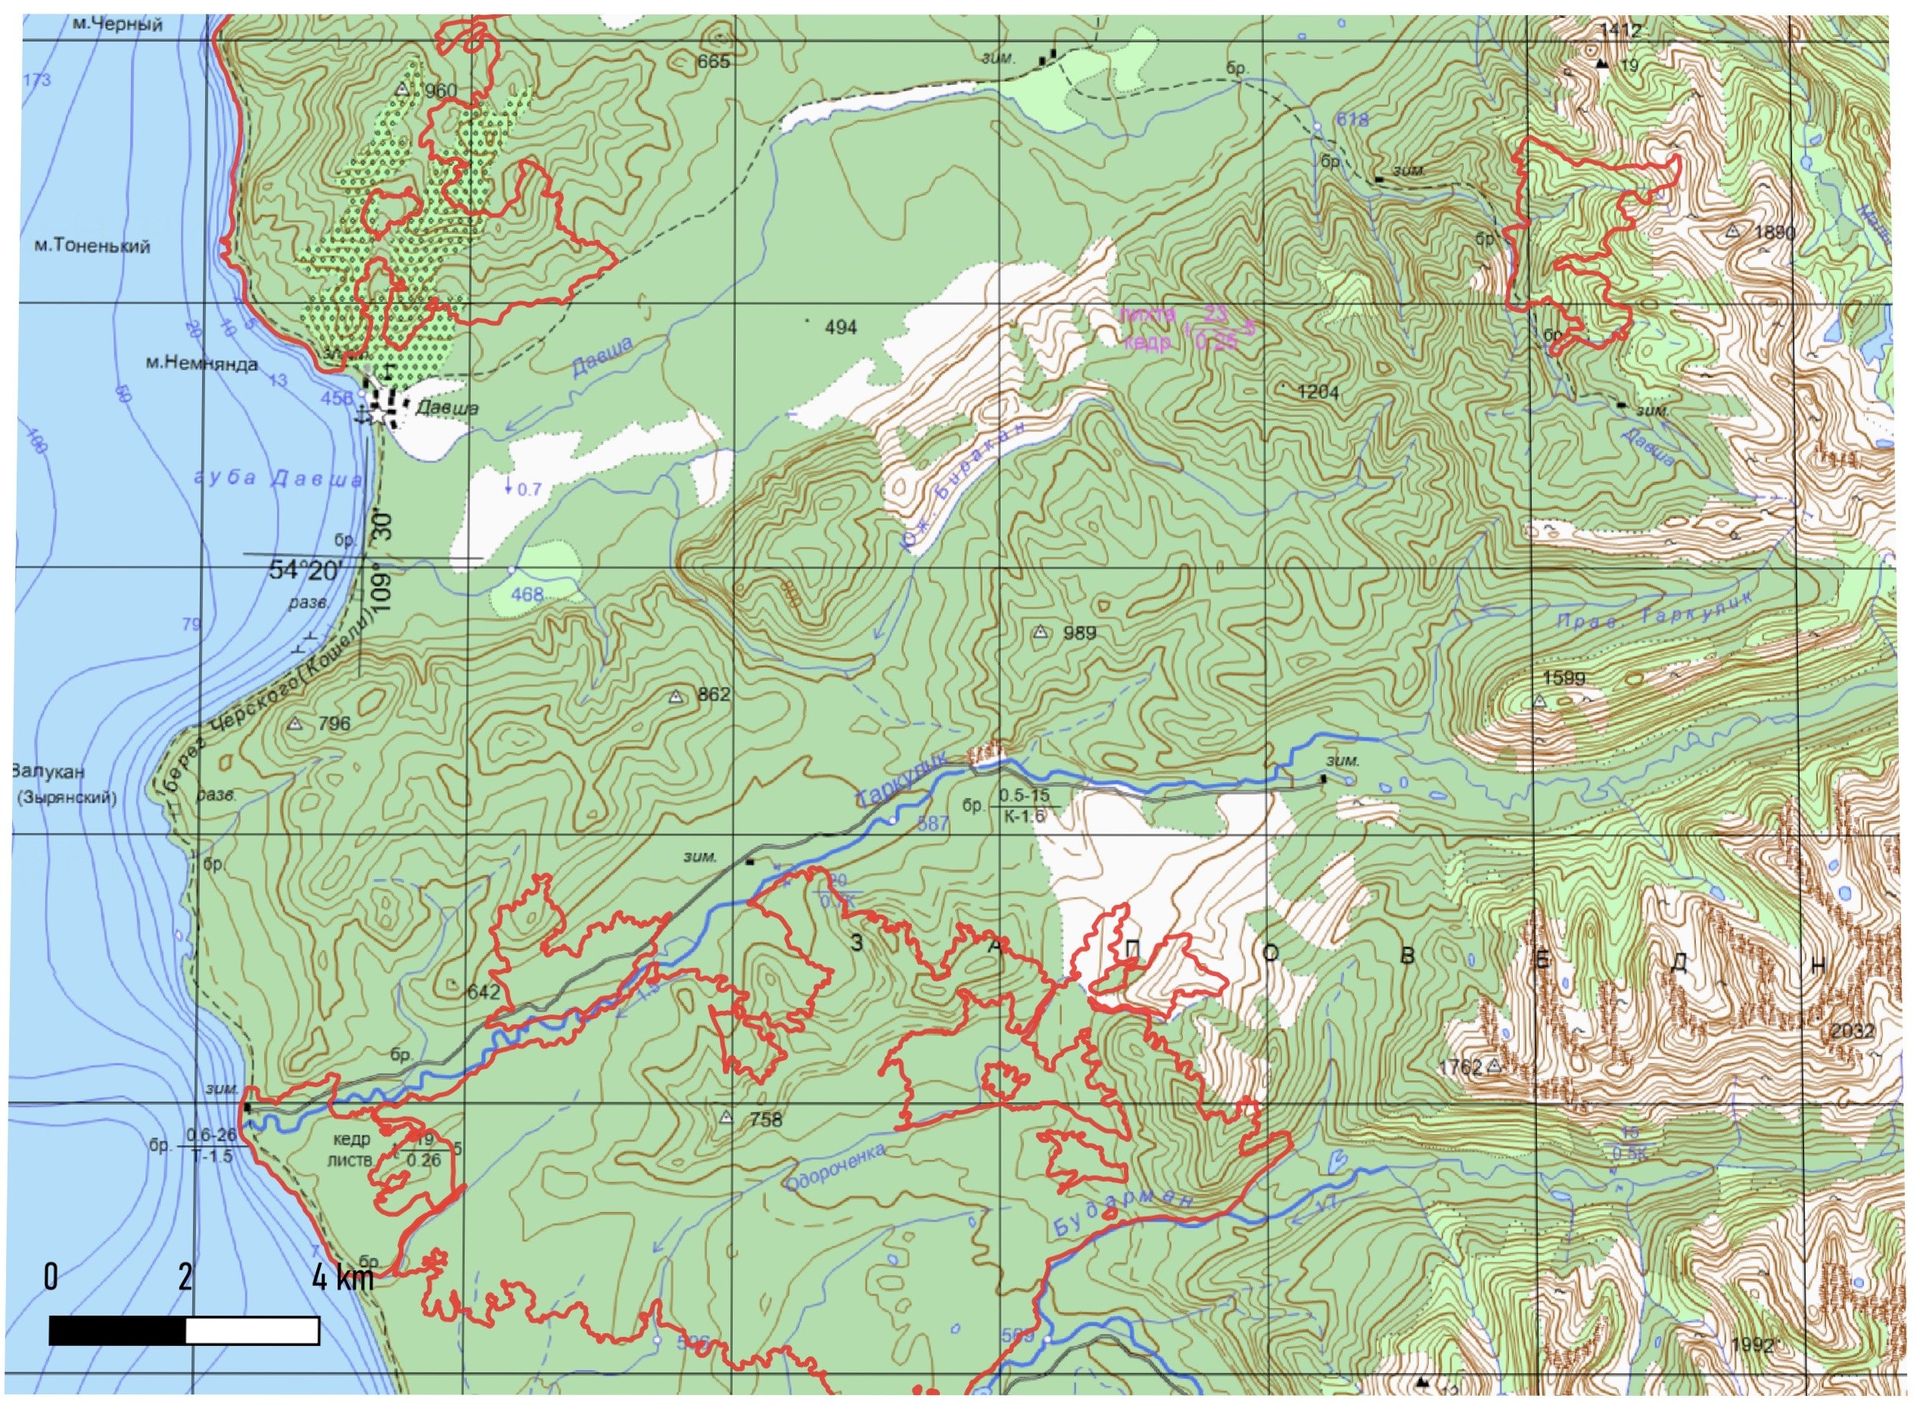
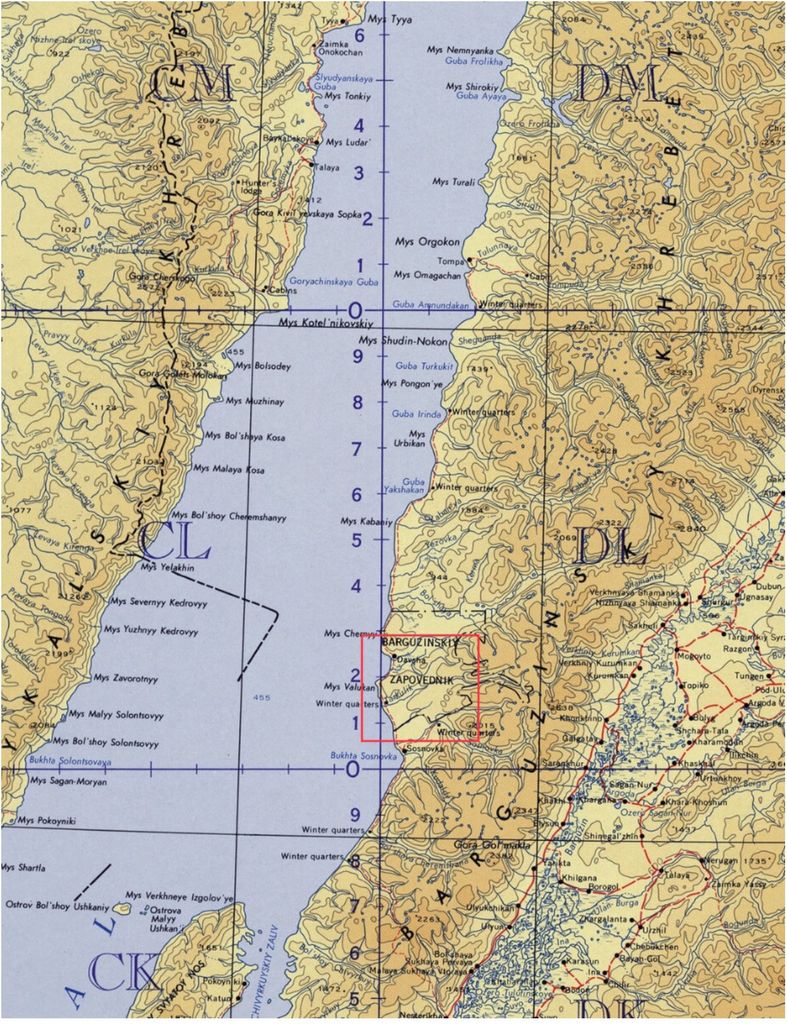
- Fig. 1. Locations of the regions of study and surveyed burned areas (marked by red line in the left image)
- Fig. 1_2. Locations of the regions of study and surveyed burned areas (marked by red line in the left image)
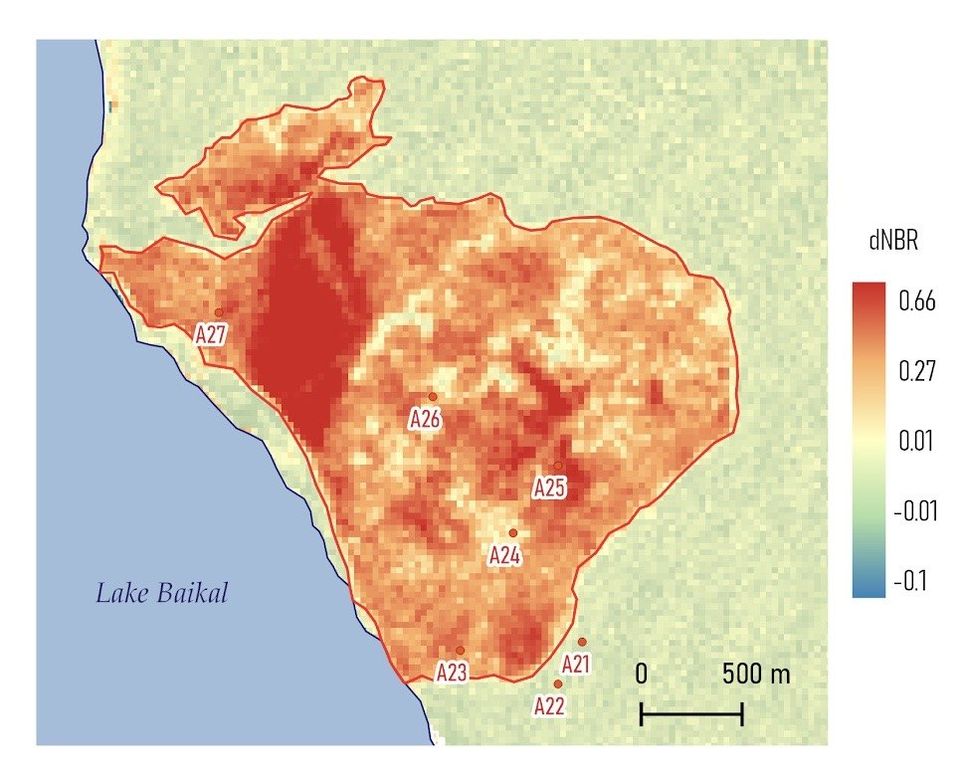
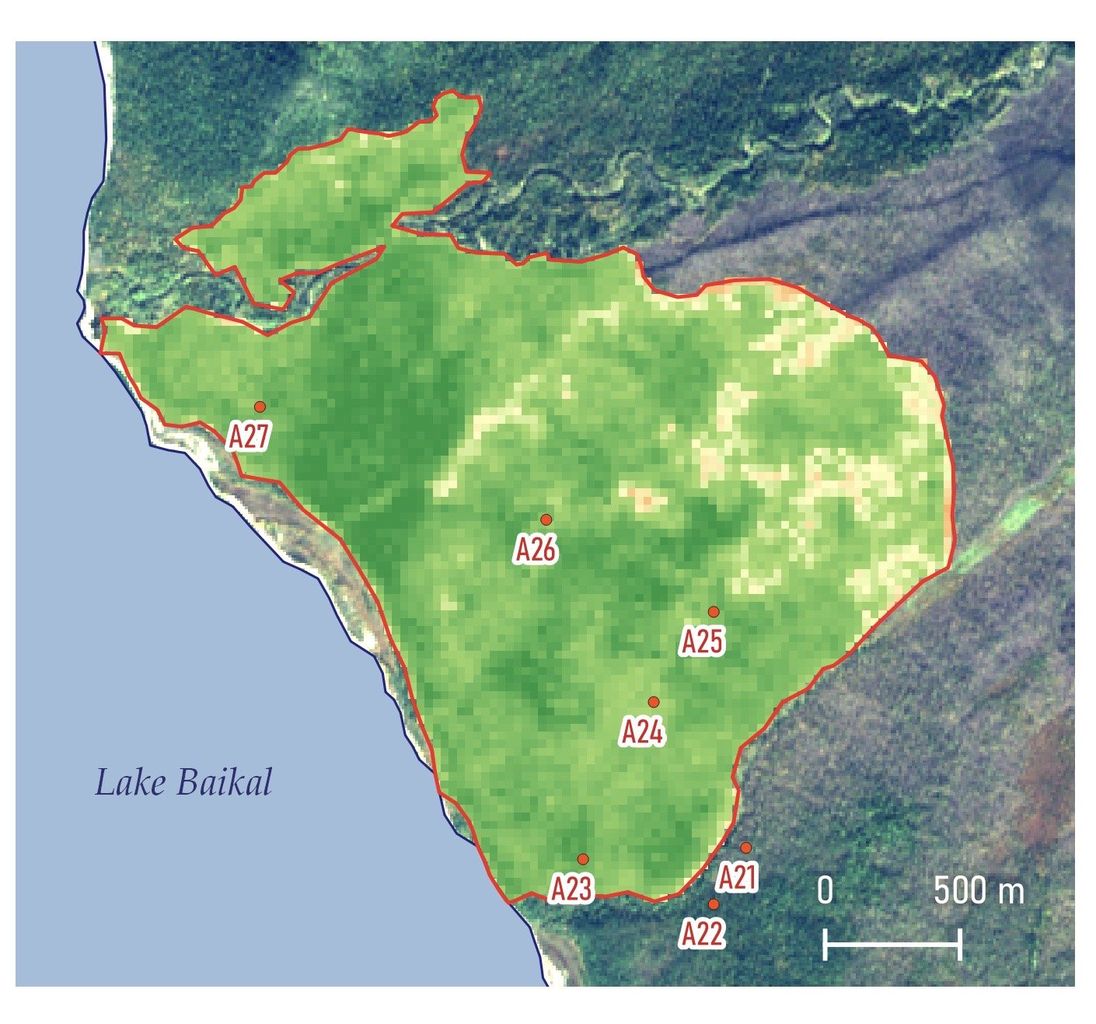
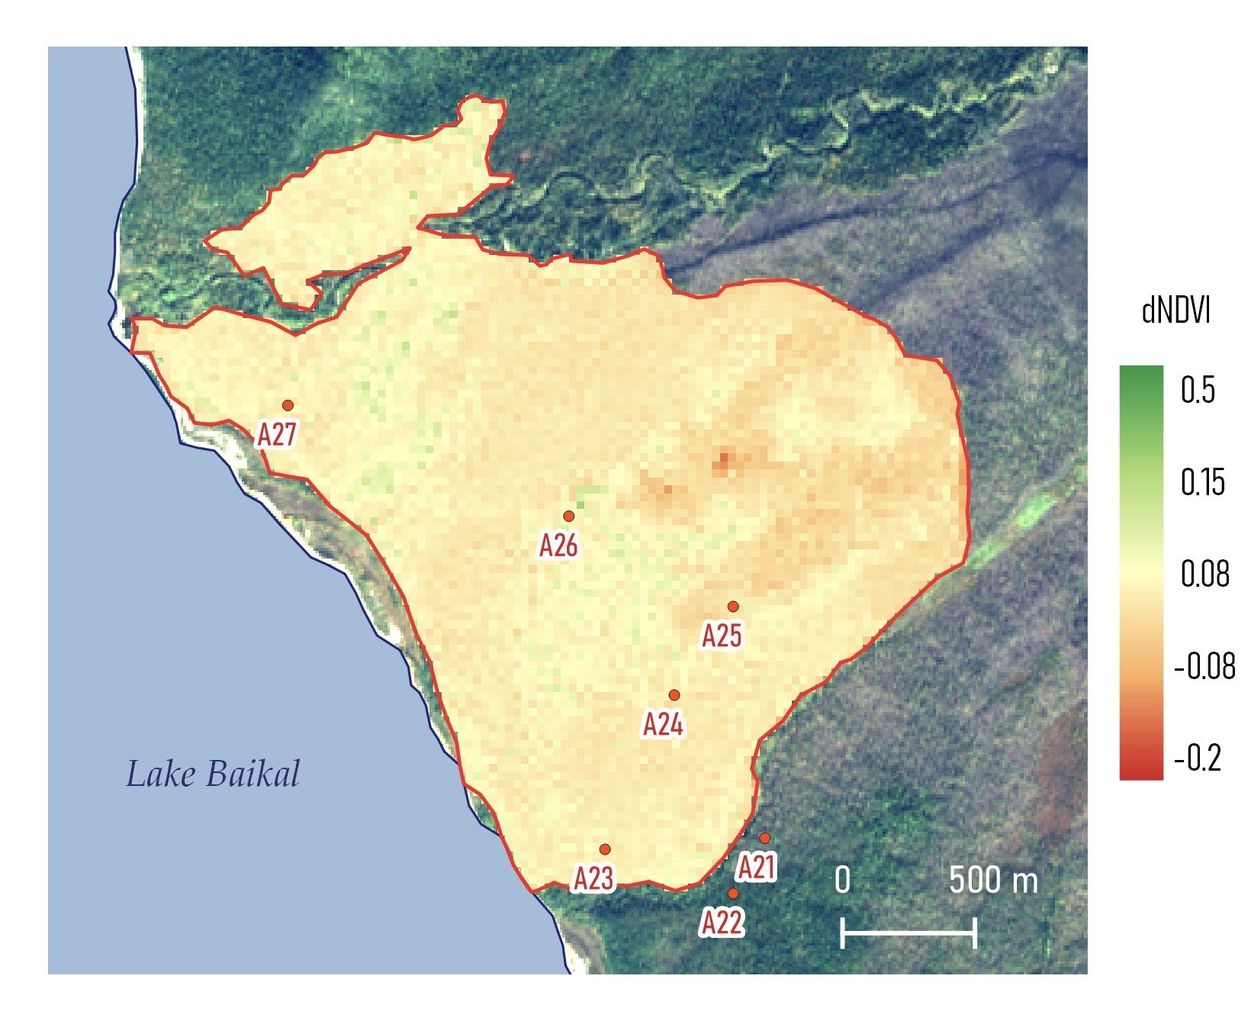
- Fig. 2. Area burned in 1995: dNBR and examples of ground cover from points 23 (middle) and 25 (right). Projection UTM WGS84 zone 49N here and further
- Fig. 2_2. Area burned in 1995: dNBR and examples of ground cover from points 23 (middle) and 25 (right). Projection UTM WGS84 zone 49N here and further
- Fig. 3. Area burned in 1995: left – changes in mid-summer NDVI in 1996–2019, right – changes in early spring NDVI in 2000–2019
- Fig. 3_2. Area burned in 1995: left – changes in mid-summer NDVI in 1996–2019, right – changes in early spring NDVI in 2000–2019
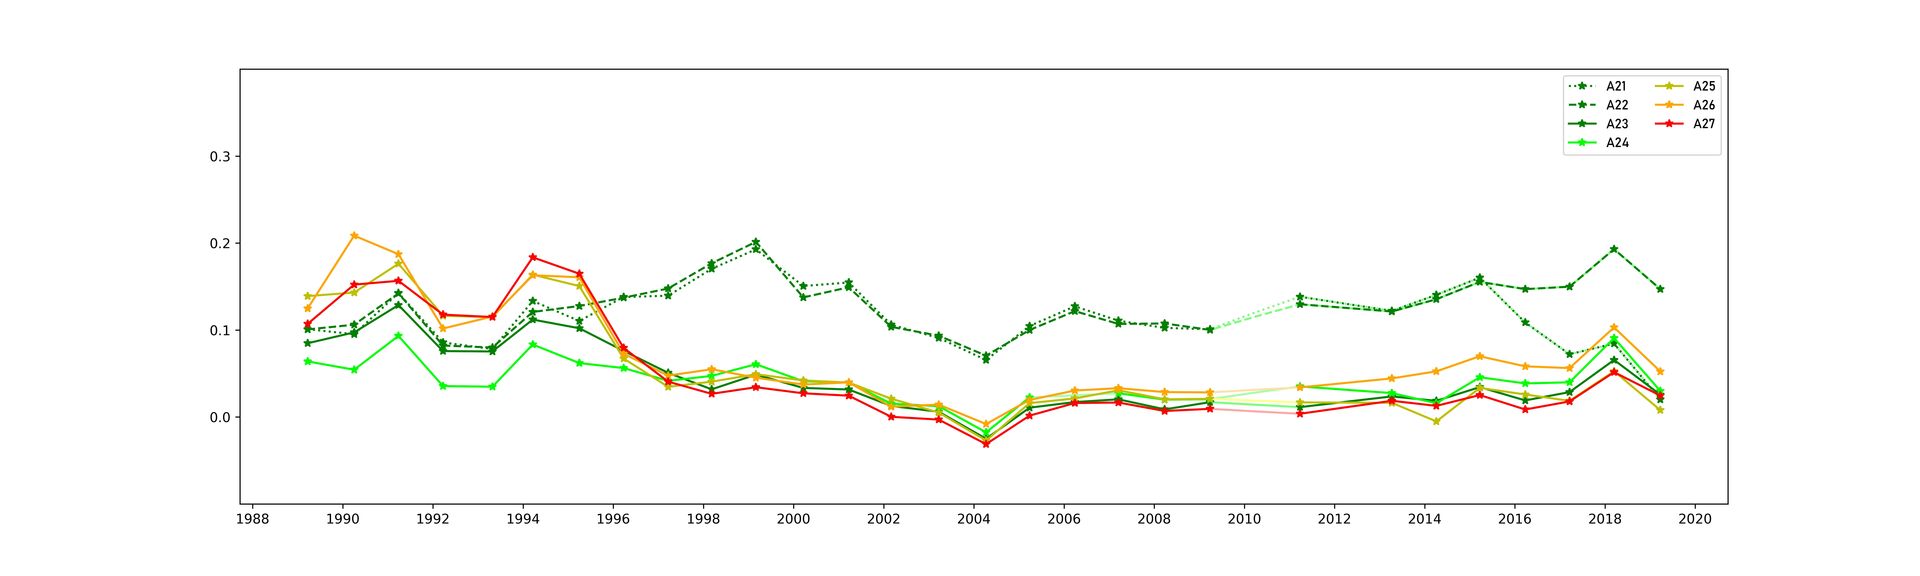
- Fig. 4. Area burned in 1995: dynamics of summer NDVI (y axis) for surveyed points in 1993–2019
- Fig. 5. Area burned in 1995: dynamics of winter NDVI (here and further y axis) for surveyed points in 1989–2019
- Fig. 6. Numbers of shoots and saplings of different species; the difference in July NDVI between the year of the latest fire (different for every point) and 2019 (dNDVI, dashed line), and cumulative cover of herbaceous vegetation (not including any shrubs or mosses, hard line). Diamonds identify patches not impacted by fire. Column of birch saplings at A21 exceeds the frame and reaches as far as 751
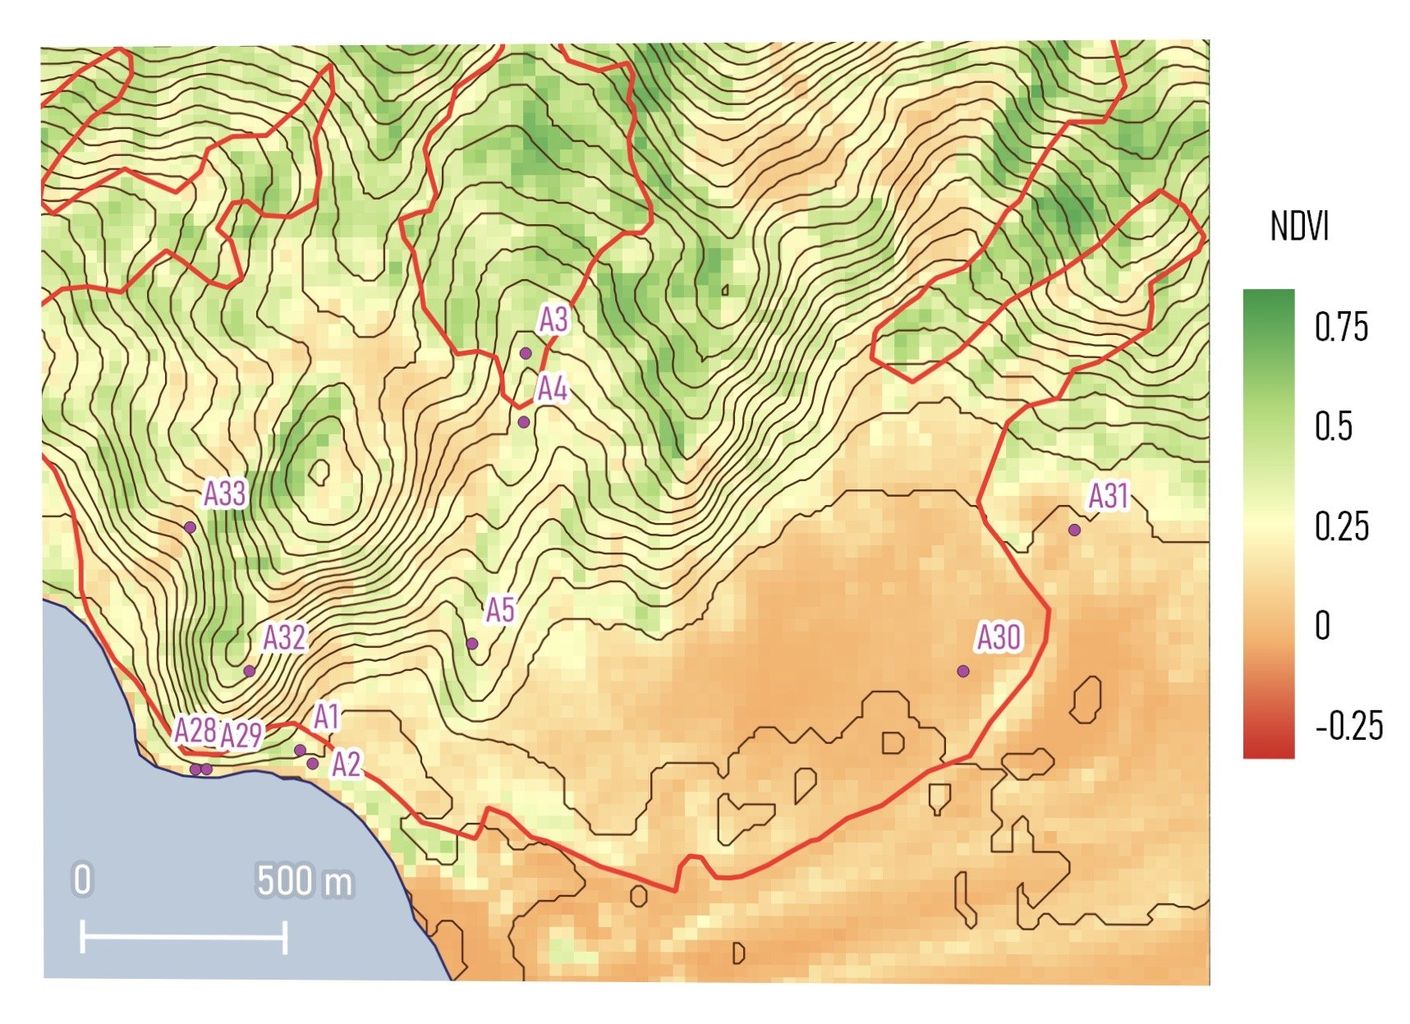
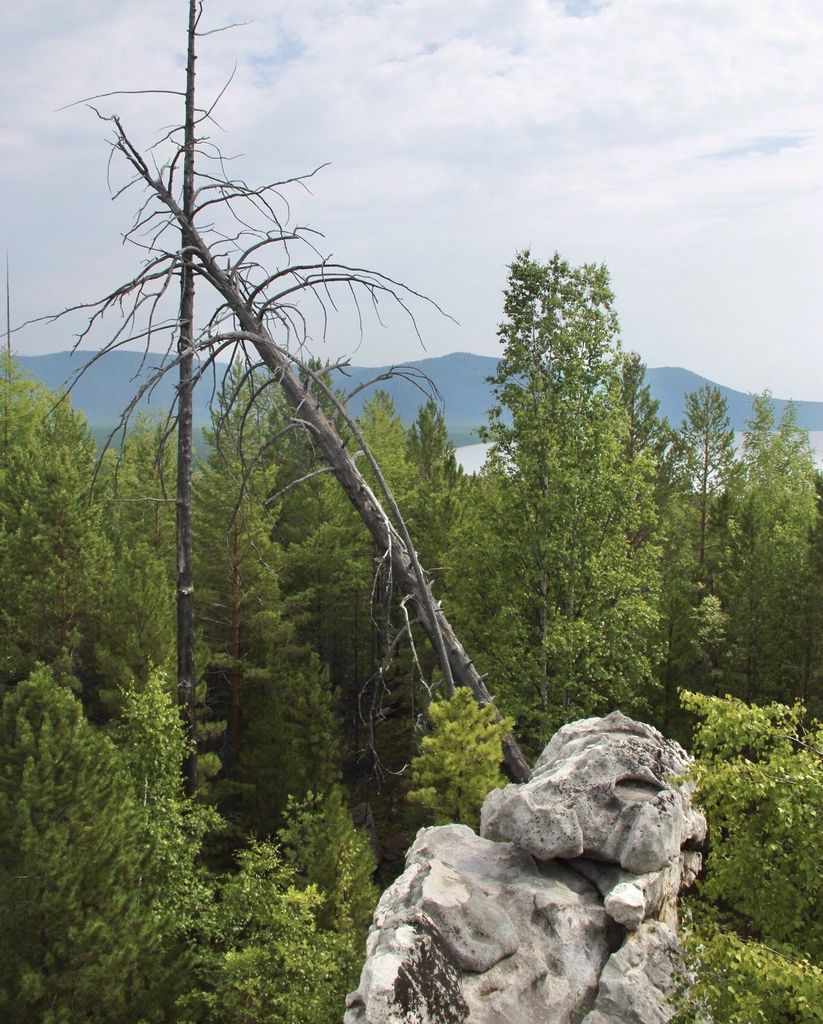
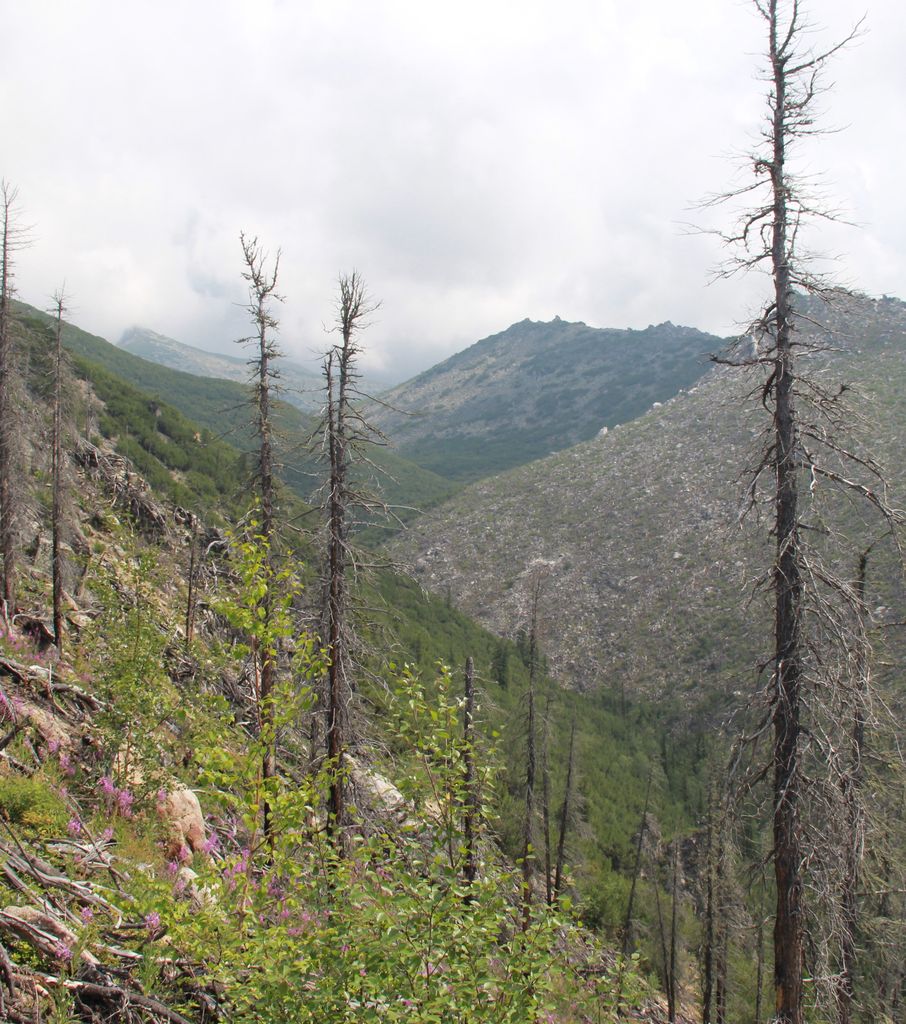
- Fig. 7. Left: area burned in 1961 (outlined) and later in 2015. March 2015 NDVI. Right: an example of after-1961-fire vegetation: Pinus sylvestris and Betula forest, dead Larix and Pinus sibirica. North of point 5
- Fig. 7_2. Left: area burned in 1961 (outlined) and later in 2015. March 2015 NDVI. Right: an example of after-1961-fire vegetation: Pinus sylvestris and Betula forest, dead Larix and Pinus sibirica. North of point 5
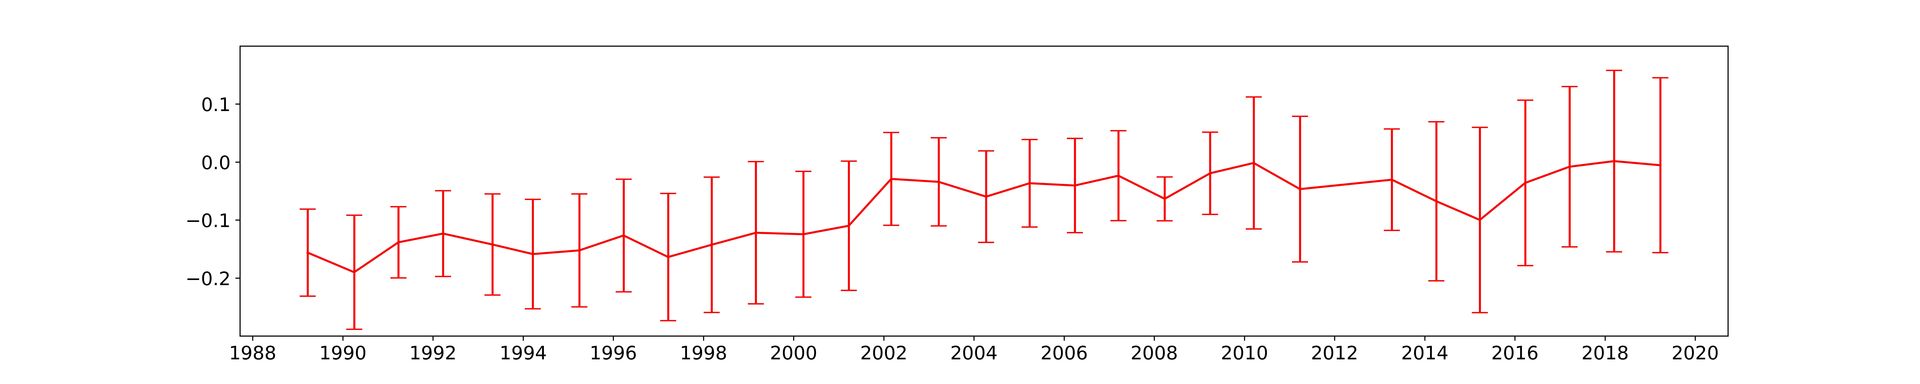
- Fig. 8. Differences between average NDVI within the area burned in 1961 and the unburned buffer zone
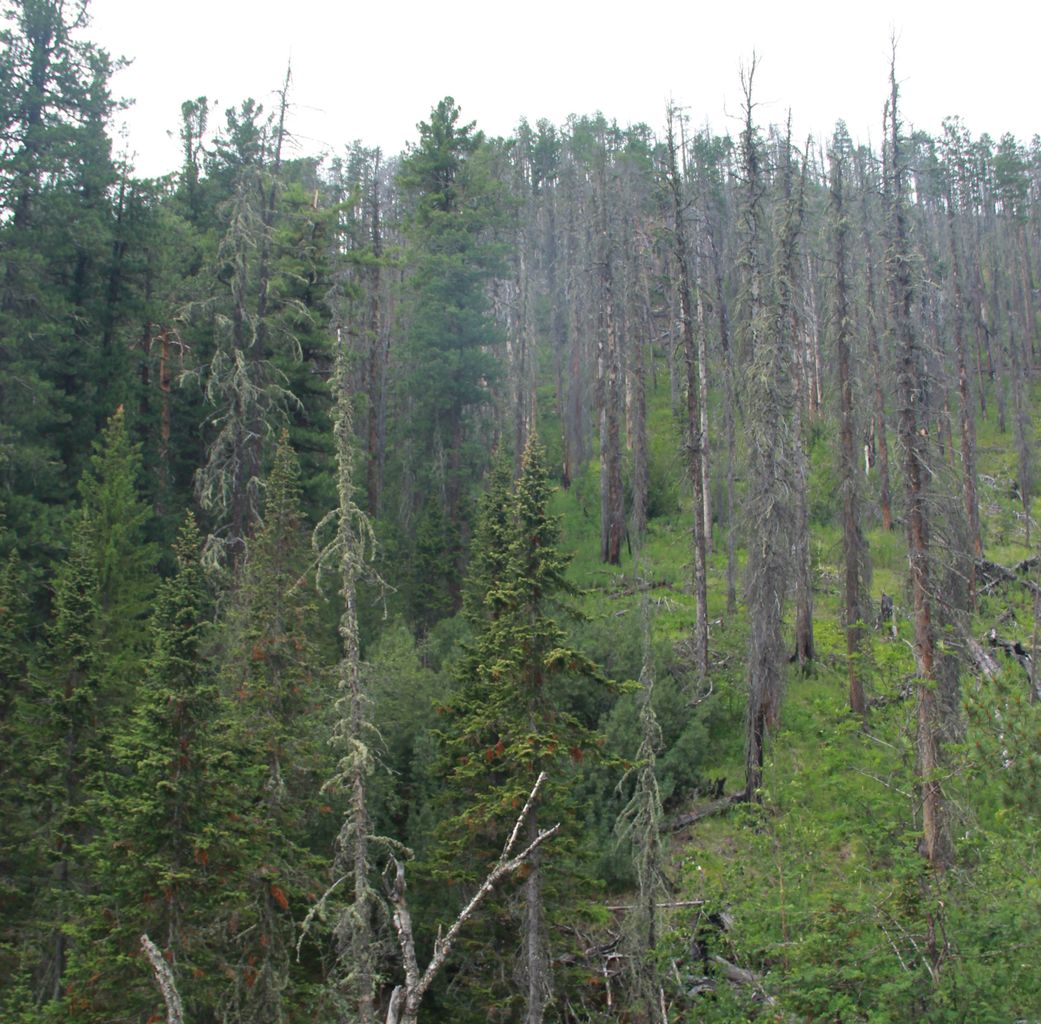
- Fig. 9. Area burned in 2006 (outlined): general view (towards point 13); surveyed points over July 2019 NDVI
- Fig. 9_2. Area burned in 2006 (outlined): general view (towards point 13); surveyed points over July 2019 NDVI
- Fig. 10. Area burned in 2006: left – early spring NDVI dynamics; right – fire severity gradient: Abies sibirica in the lower part of the slope, survived Pinus sylvestris in the upper
- Fig. 10_2. Area burned in 2006: left – early spring NDVI dynamics; right – fire severity gradient: Abies sibirica in the lower part of the slope, survived Pinus sylvestris in the upper
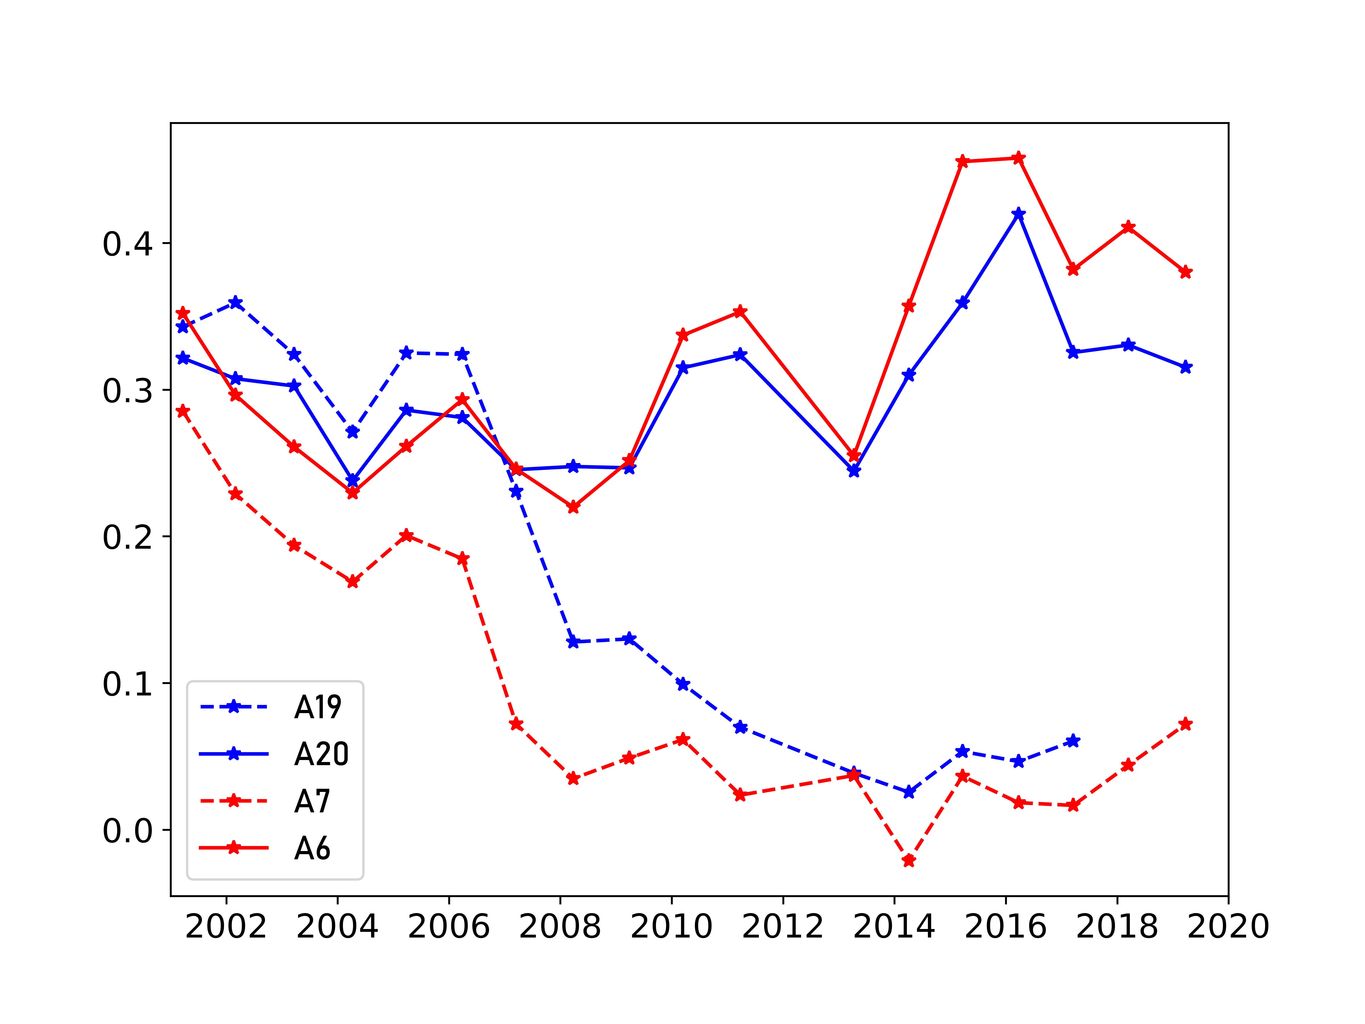
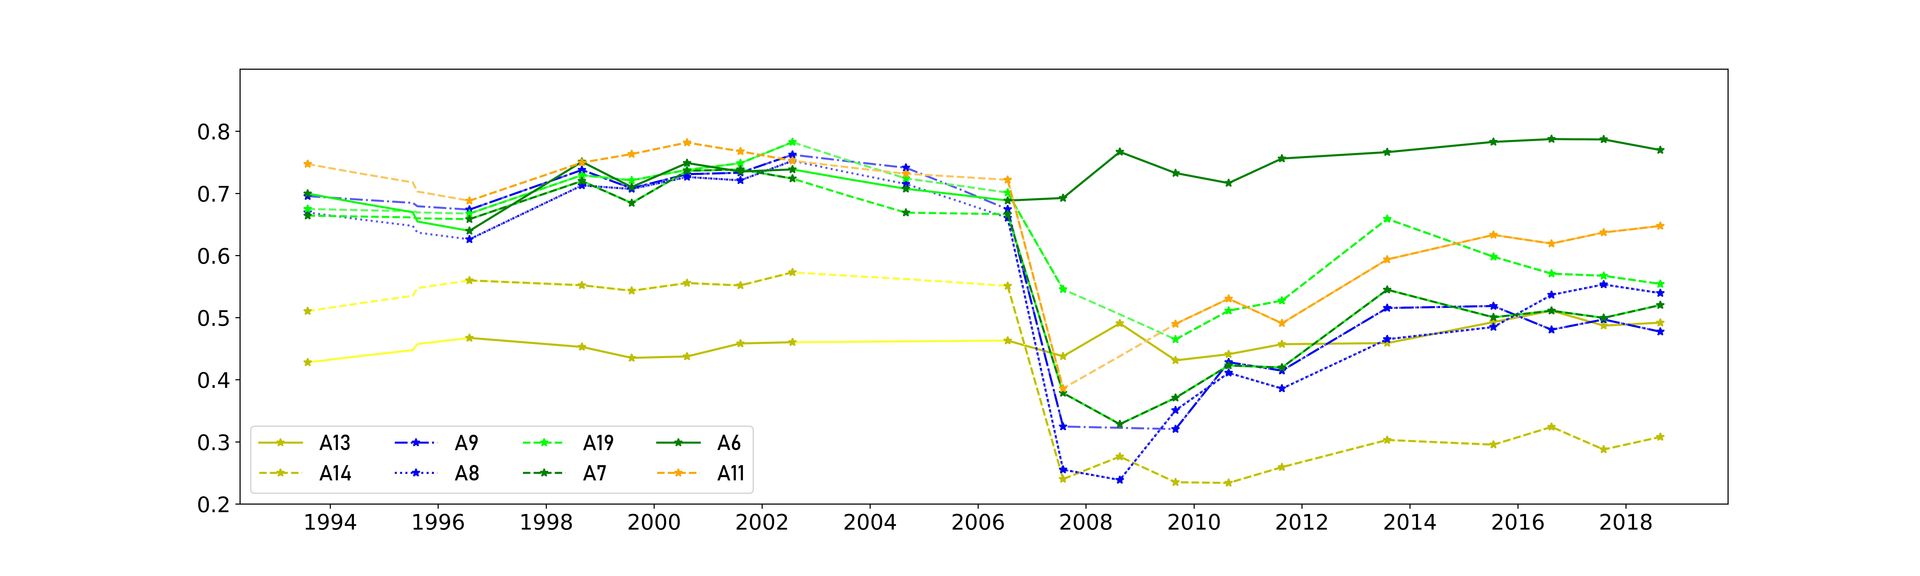
- Fig. 11. Area burned in 2006: summer NDVI dynamics for the selected points
Copyright © 2016 RJEE. THE ONLINE EDITION IS REGISTERED IN THE FEDERAL SERVICE FOR SUPERVISION OF COMMUNICATIONS, INFORMATION TECHNOLOGY, AND MASS MEDIA. REGISTRATION CERTIFICATE № FS 77 – 62950 from 04.09.2015.