


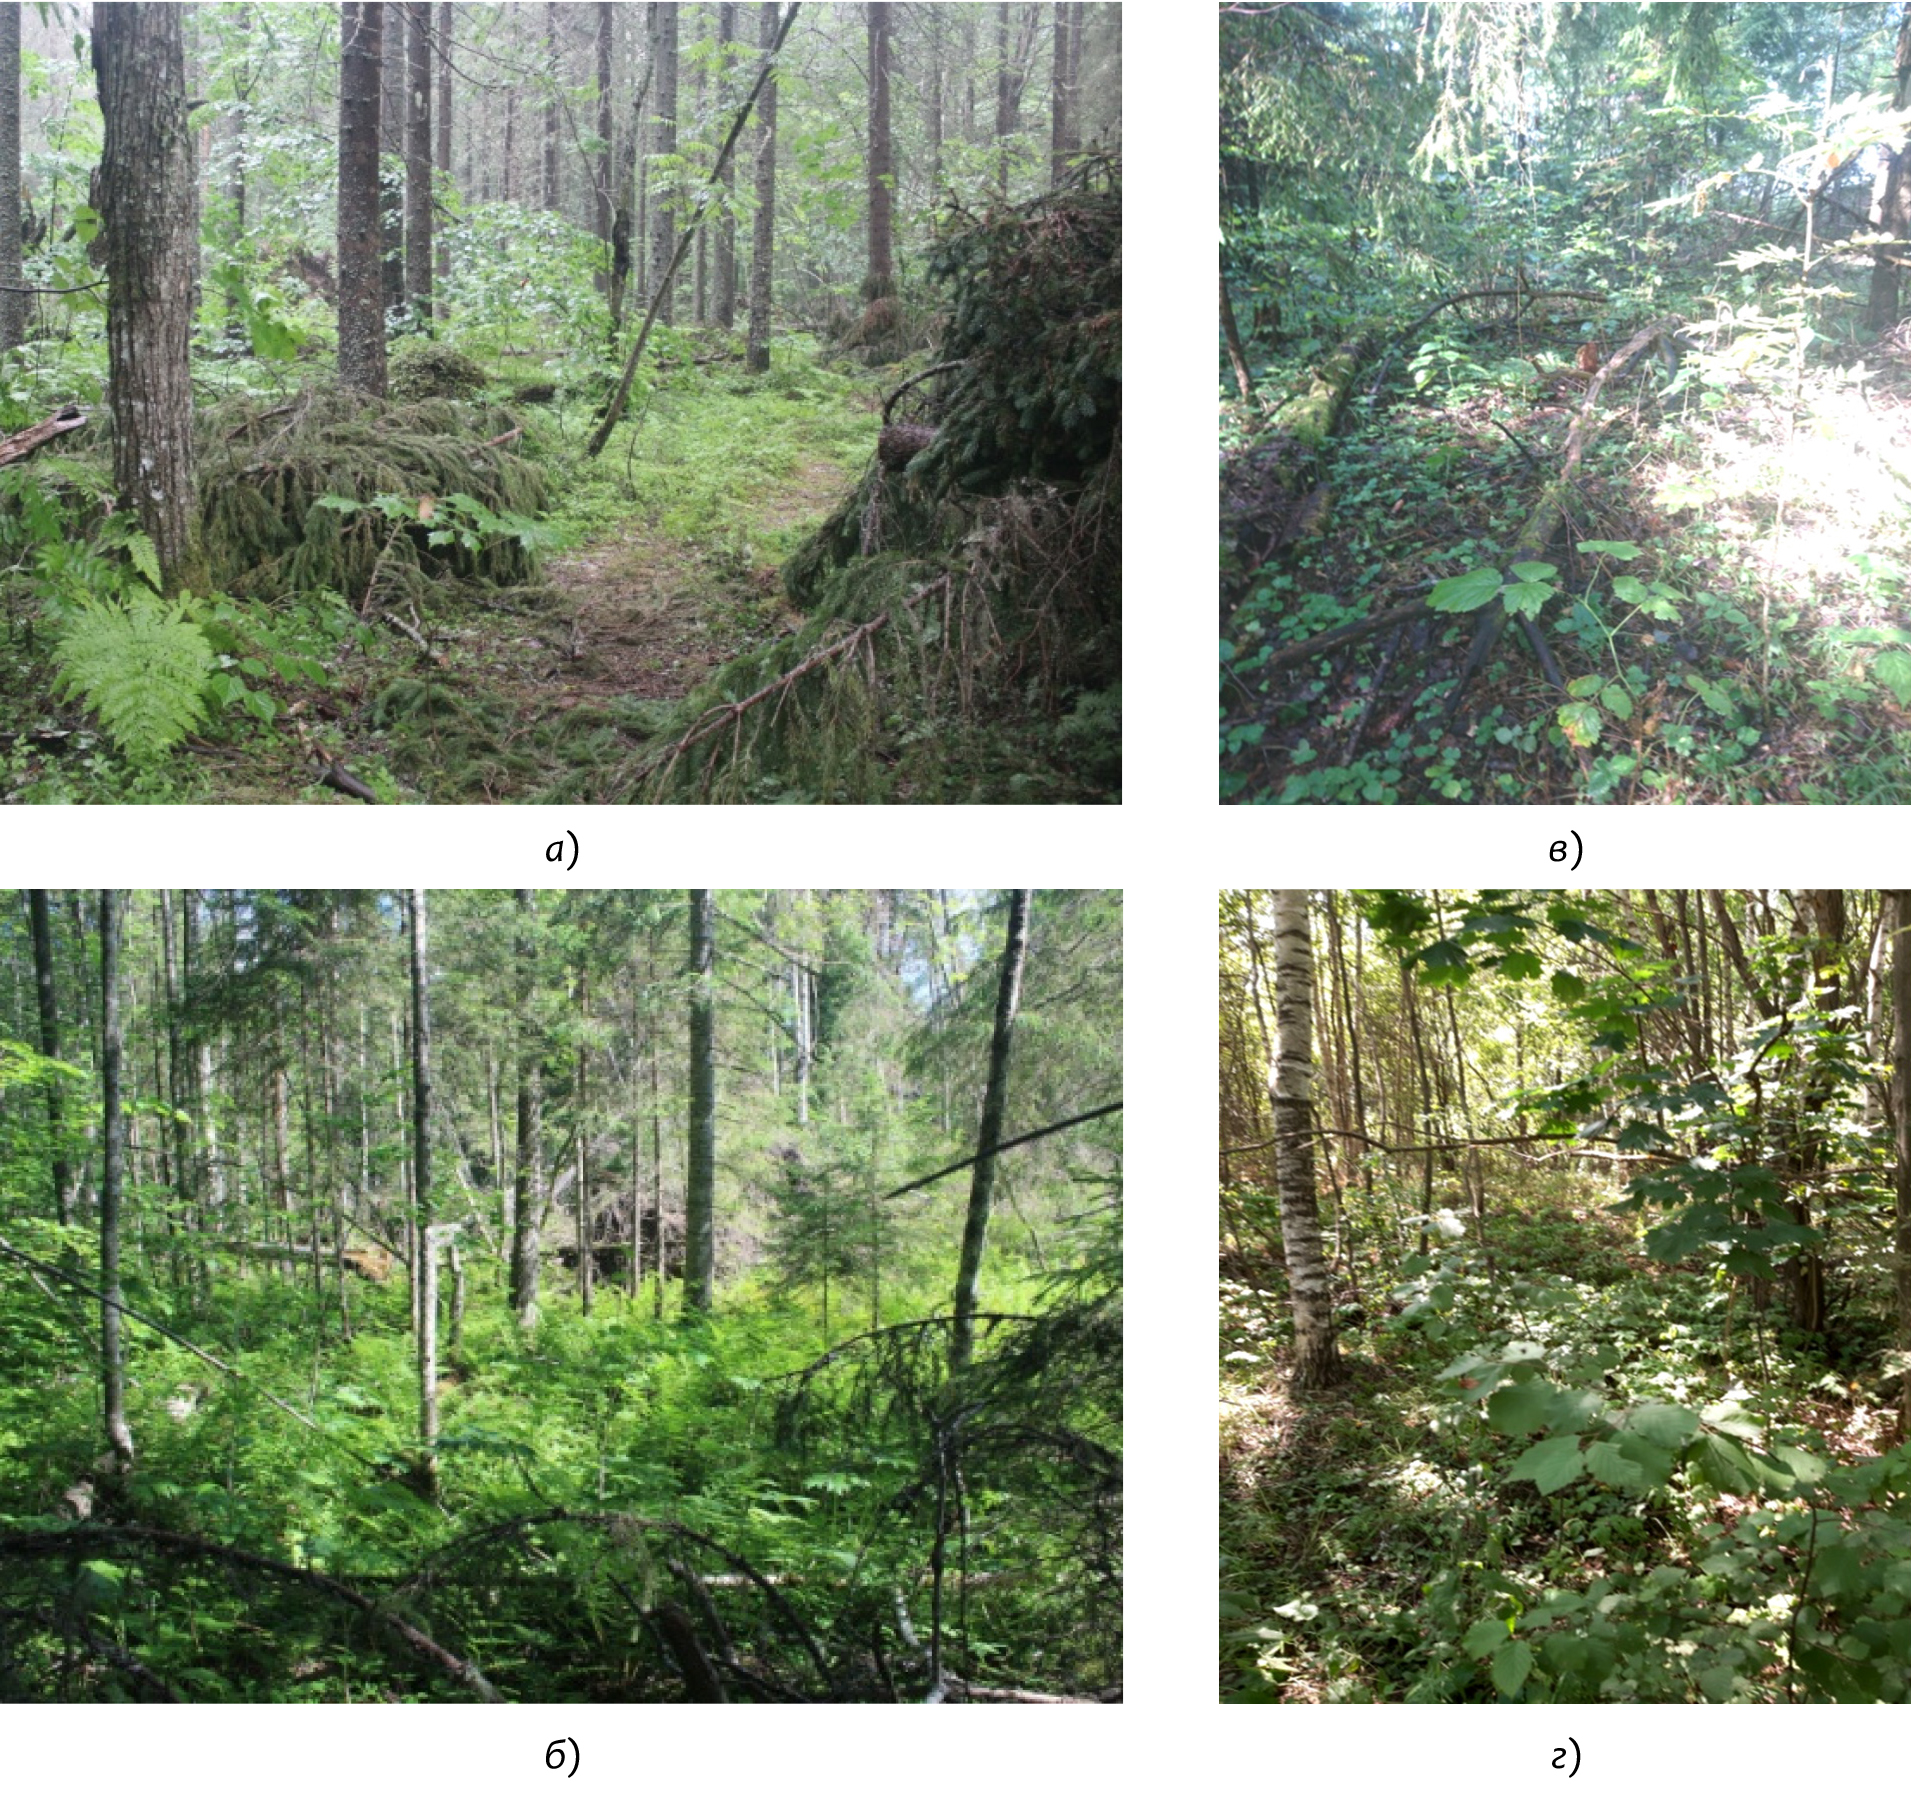
- Fig. 1. Photos of the studied biotopes: a – linden sorrel spruce forest; b – woodrush-oxalis spruce forest; c – oxalis spruce forest with hazel undergrowth; d – aise-weed birch forest (on the right of the photo – on the territory of the biosphere reserve; on the left of the photo – on the territory of the Kostroma forestry)
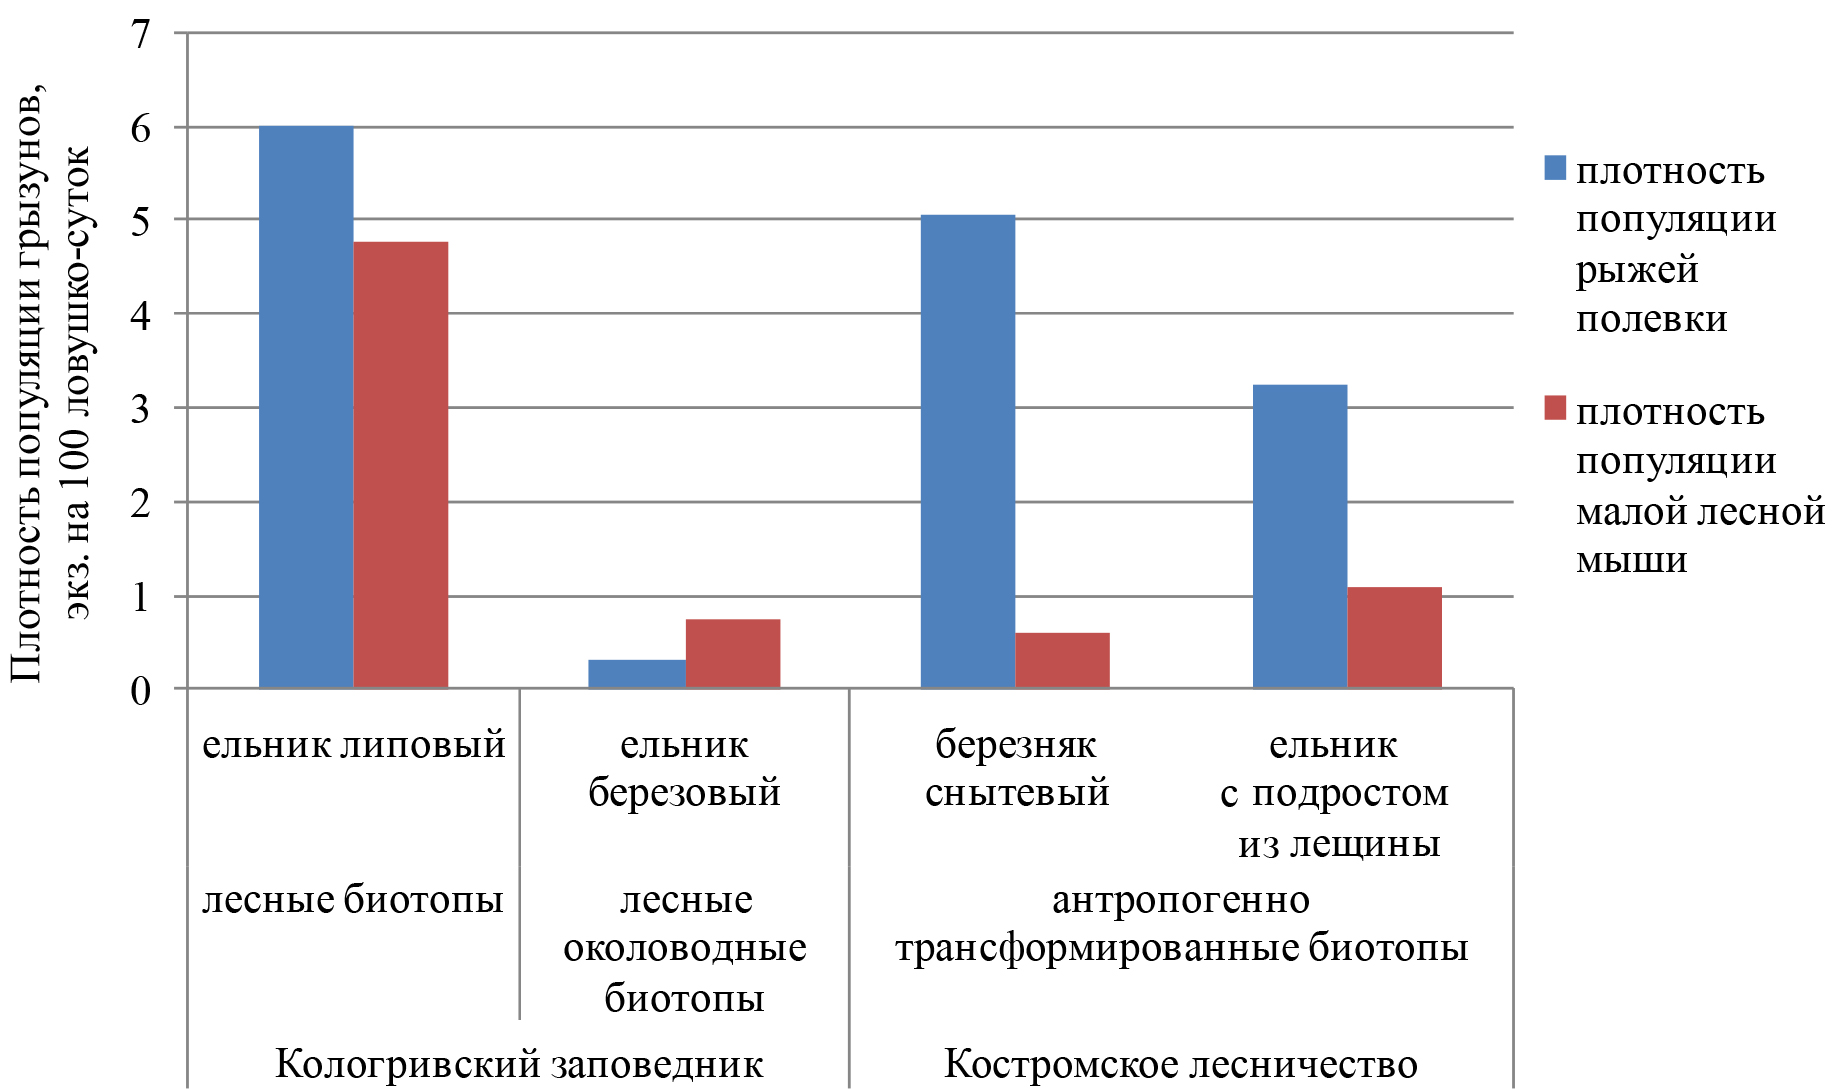
- Fig. 2. Population density of mouse–like rodents on the territory of the biosphere reserve and Kostroma forestry in June-July 2023
- Fig. 3. Correlation of the occurrence of rodents and species of vegetation in the Kostroma region: 1–19 – types of vegetation (gray triangles): 1 – Oxalis acetosella L.; 2 – Dryopteris filix-mas L.; 3 – Stellaria holostea L.; 4 – Trientalis europaea L.; 5 – Rubus saxatilis L.; 6 – Luzula pilosa L.; 7 – Maianthemum bifolium L.; 8 – Galium verum L.; 9 – Asarum europaeum L.; 10 – Chelidonium majus L.; 11 – Aegopodium podagraria L.; 12 – Urtica dioica L.; 13 – Convallaria majalis L.; 14 – Brunnera macrophylla (Adams) I.M. Johnst.); 15 – Festuca pratensis Huds.; 16 – Fragaria vesca L.; 17–18 – rodents (red triangles): 17 – Myodes glareolus Schreber; 18 – Apodemus uralensis Pallas. Only significant dependencies are reflected (p < 0,05). The solid line is a positive correlation; the dotted line is a negative correlation. The line thickness reflects the strength of the connection – weak (rs < |0,50|), medium (|0,50|< rs <|0,75|) and strong (rs > |0,75|)
- Fig. 4. Dentrogram of clustering of plant associations (1‒11) according to environmental indicators (illumination L, temperature regime T, continentality K, soil moisture F, soil acidification R and soil nitrogen richness N): 1 – linden-oxalis spruce forest; 2 – oxalis-shield-fern spruce forest; 3 – woodrush-oxalis spruce forest; 4 – blueberry-oxalis spruce forest; 5 – breadruby spruce forest; 6 – hazelwort-oxalis spruce forest; 7 – oxalis spruce forest with undergrowth of hazel; 8 – oxalis-celandine spruce forest aise-weed birch forest; 9 –; 10 – aise-weed – strawberry birch forest; 11 – aise-weed – hazelwort – goldenrod- sedge birch forest
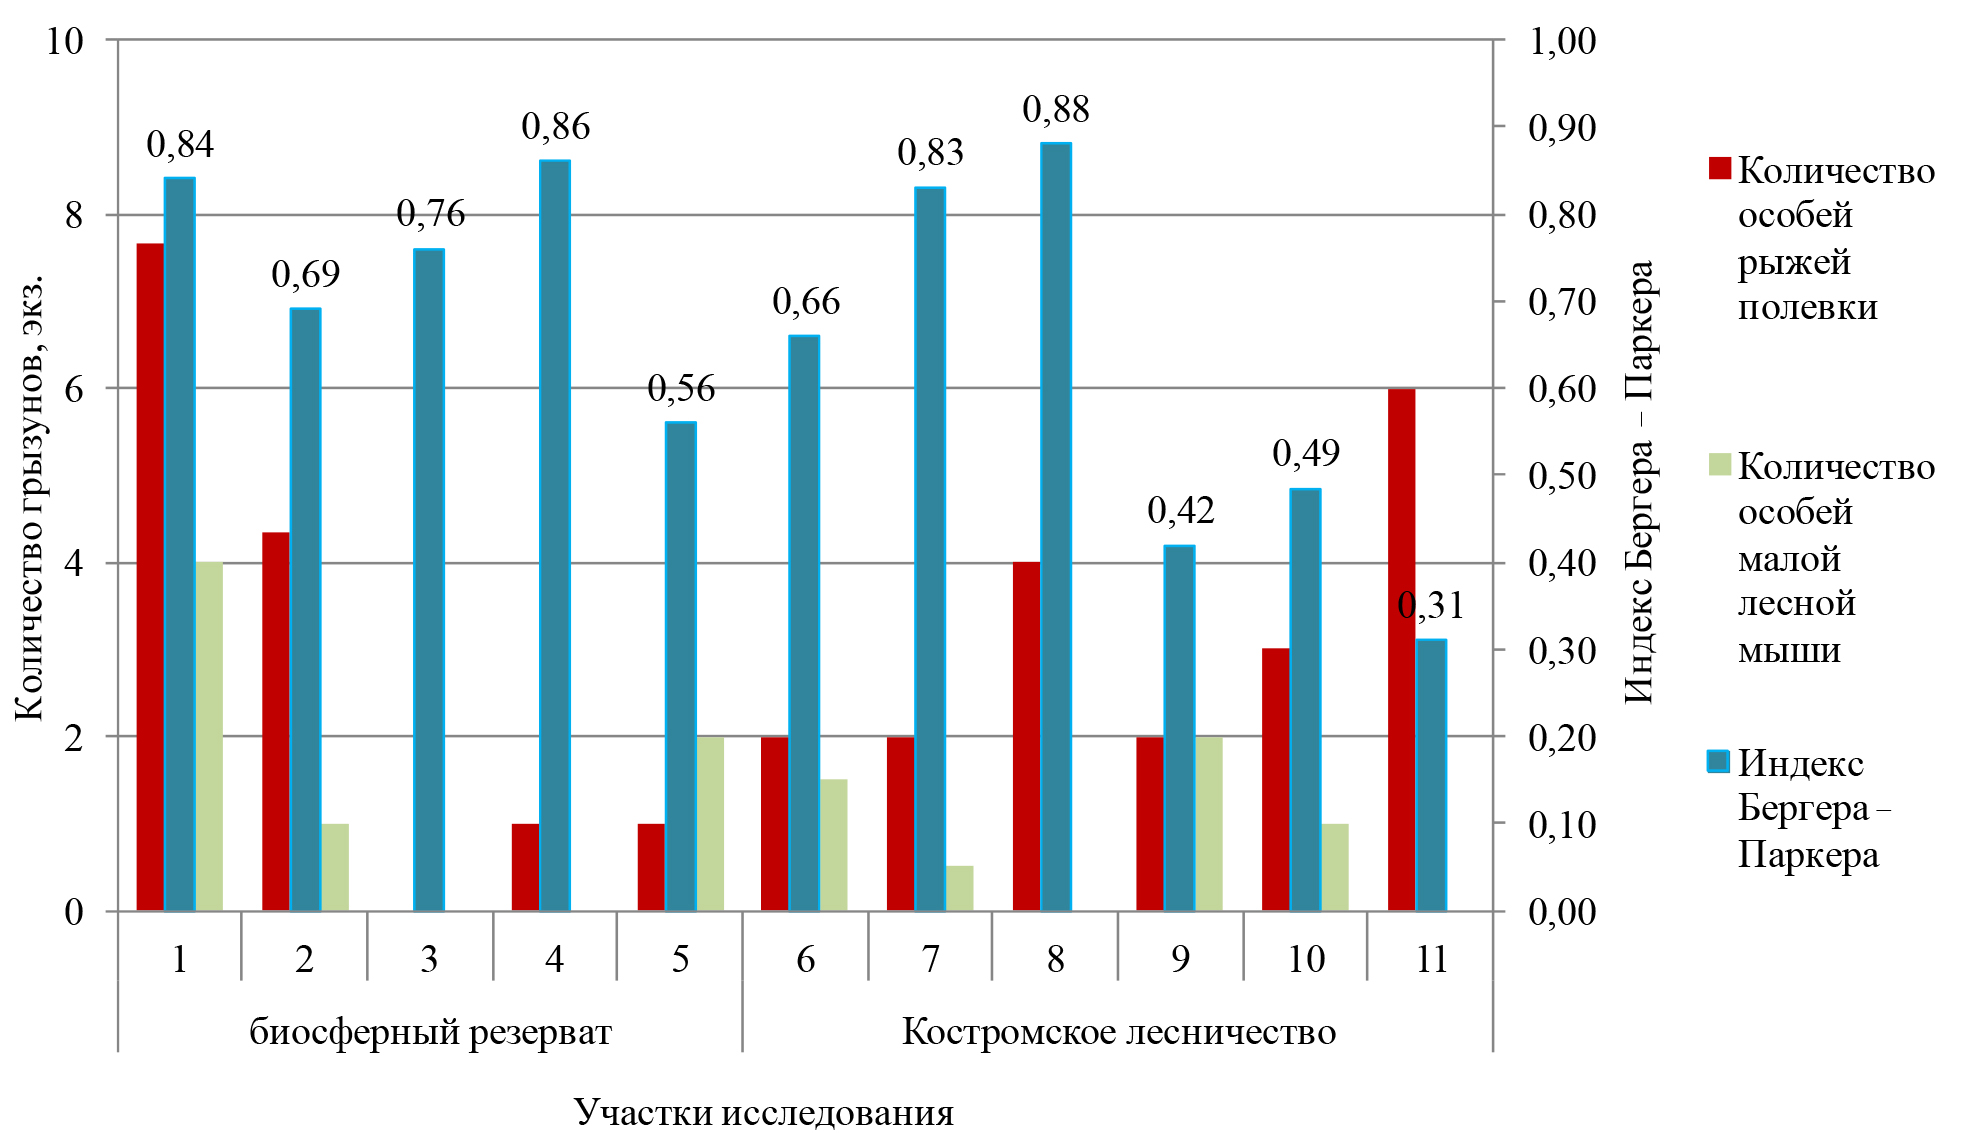
- Fig. 5. Variation in the number of rodents and the index of dominance in the plant associations of the Kostroma region
- Fig. 6. Variation in the number of rodents and the indicator of projective coverage in the plant associations of the Kostroma region



Copyright © 2016 RJEE. THE ONLINE EDITION IS REGISTERED IN THE FEDERAL SERVICE FOR SUPERVISION OF COMMUNICATIONS, INFORMATION TECHNOLOGY, AND MASS MEDIA. REGISTRATION CERTIFICATE № FS 77 – 62950 from 04.09.2015.