


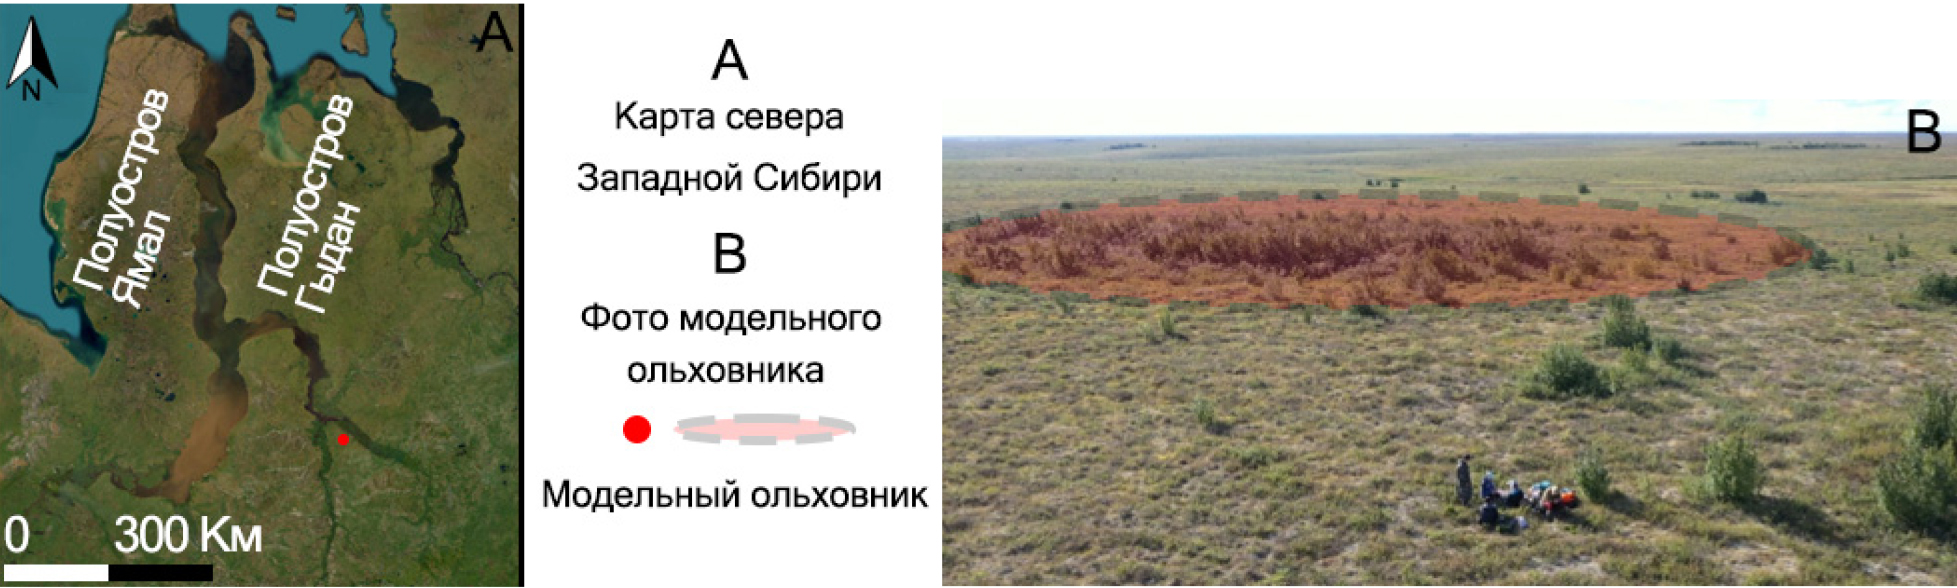
- Fig. 1. Schematic map of the study area (A) and photo of the model alder thicket (B)
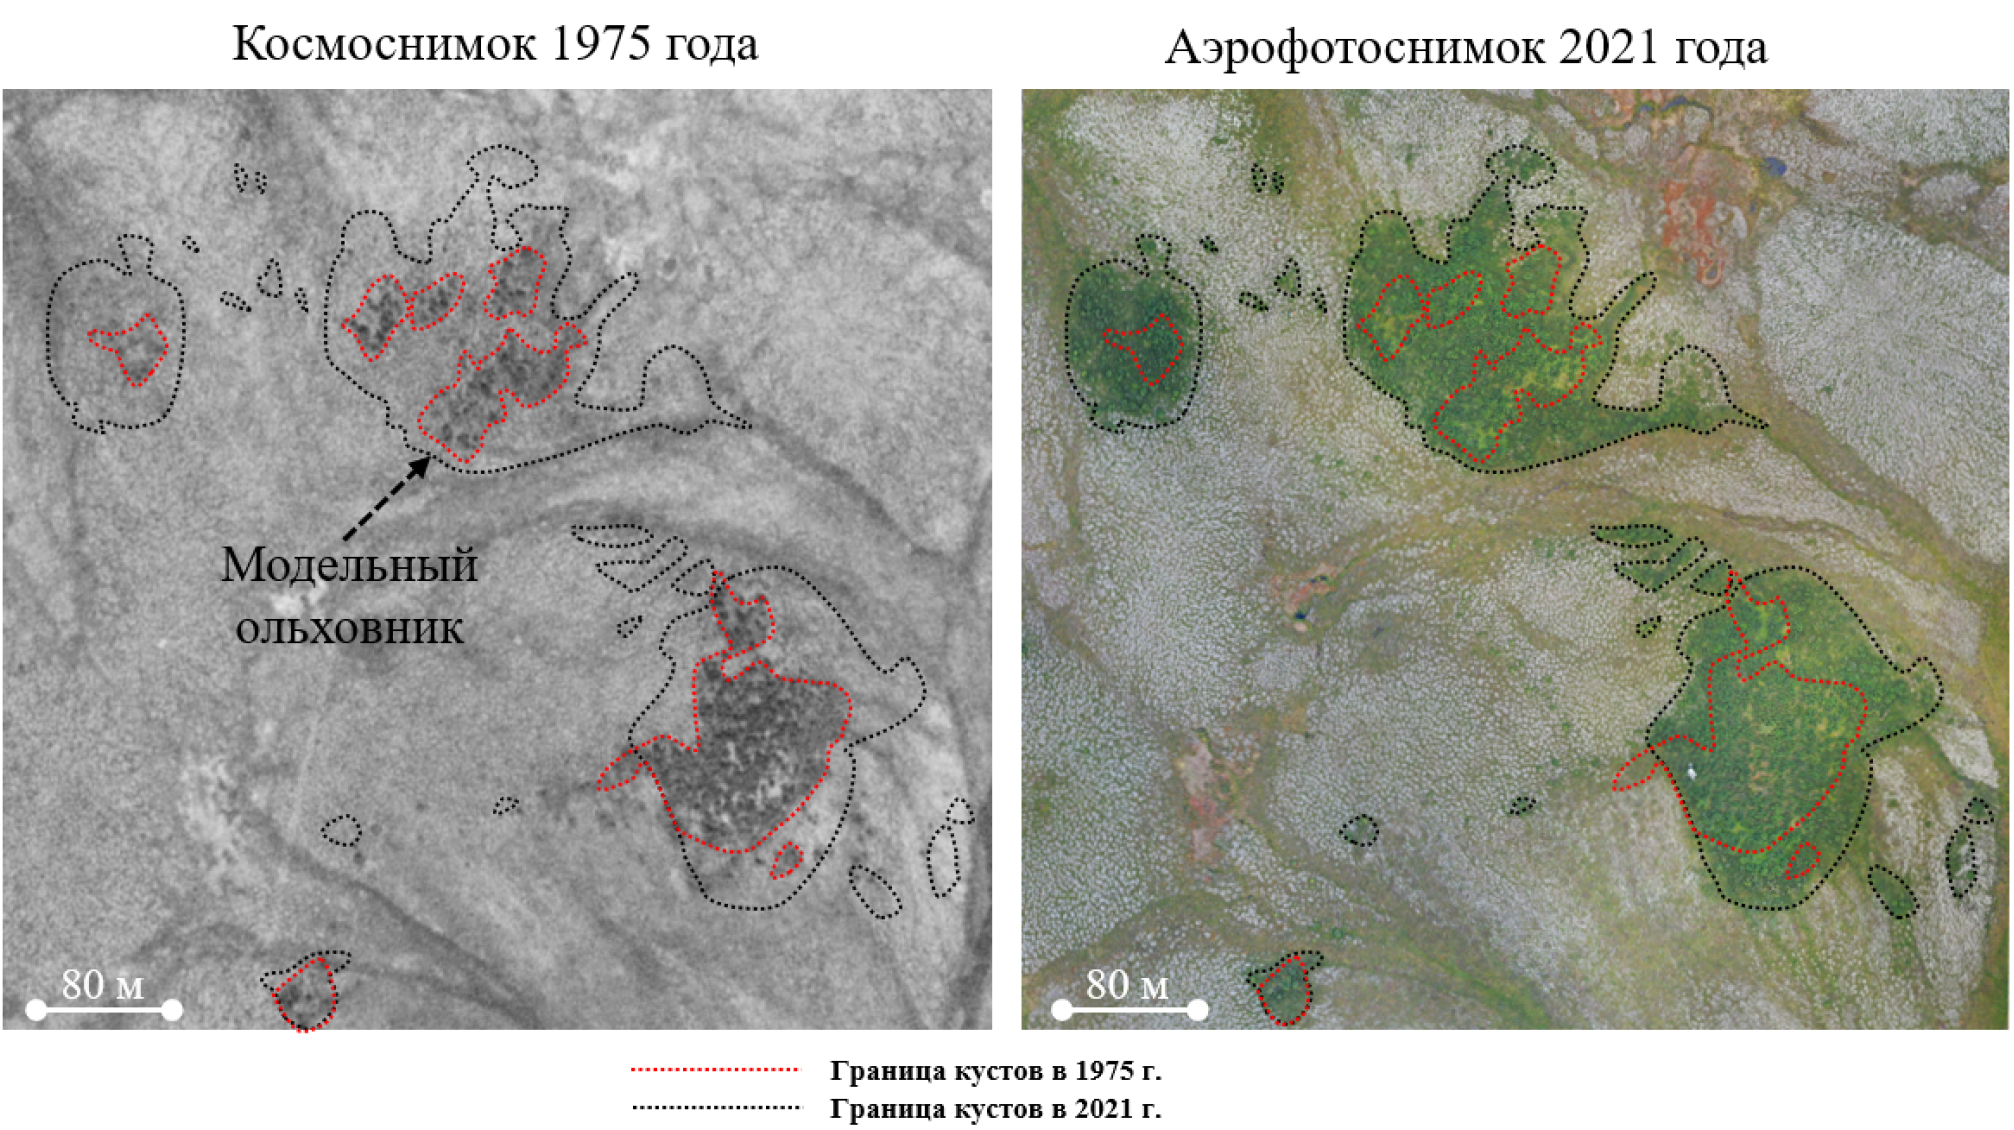
- Fig. 2. Increase in the area of the model alder thicket in the Taz tundra according to multi-temporal satellite images (1975 and 2021)
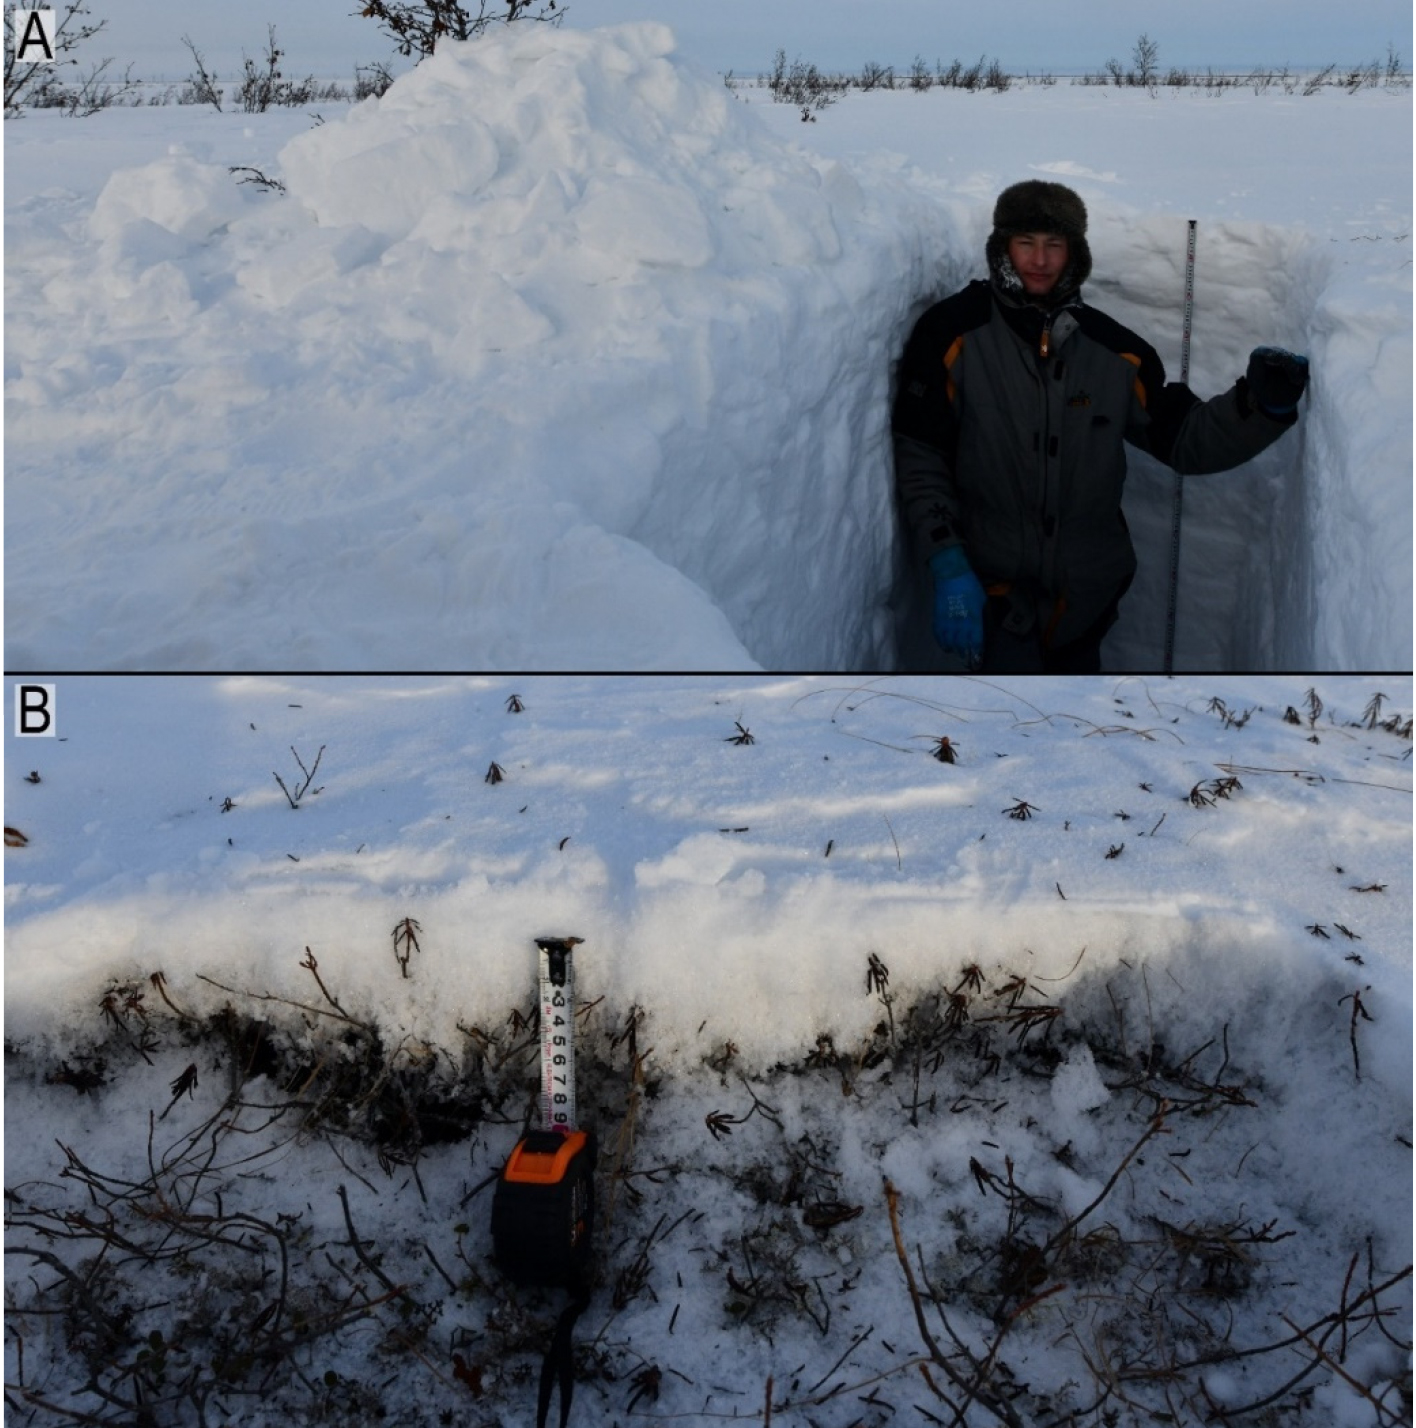
- Fig. 3. Comparison of snow cover thickness inside the alder thicket (A) and in the background tundra (B)
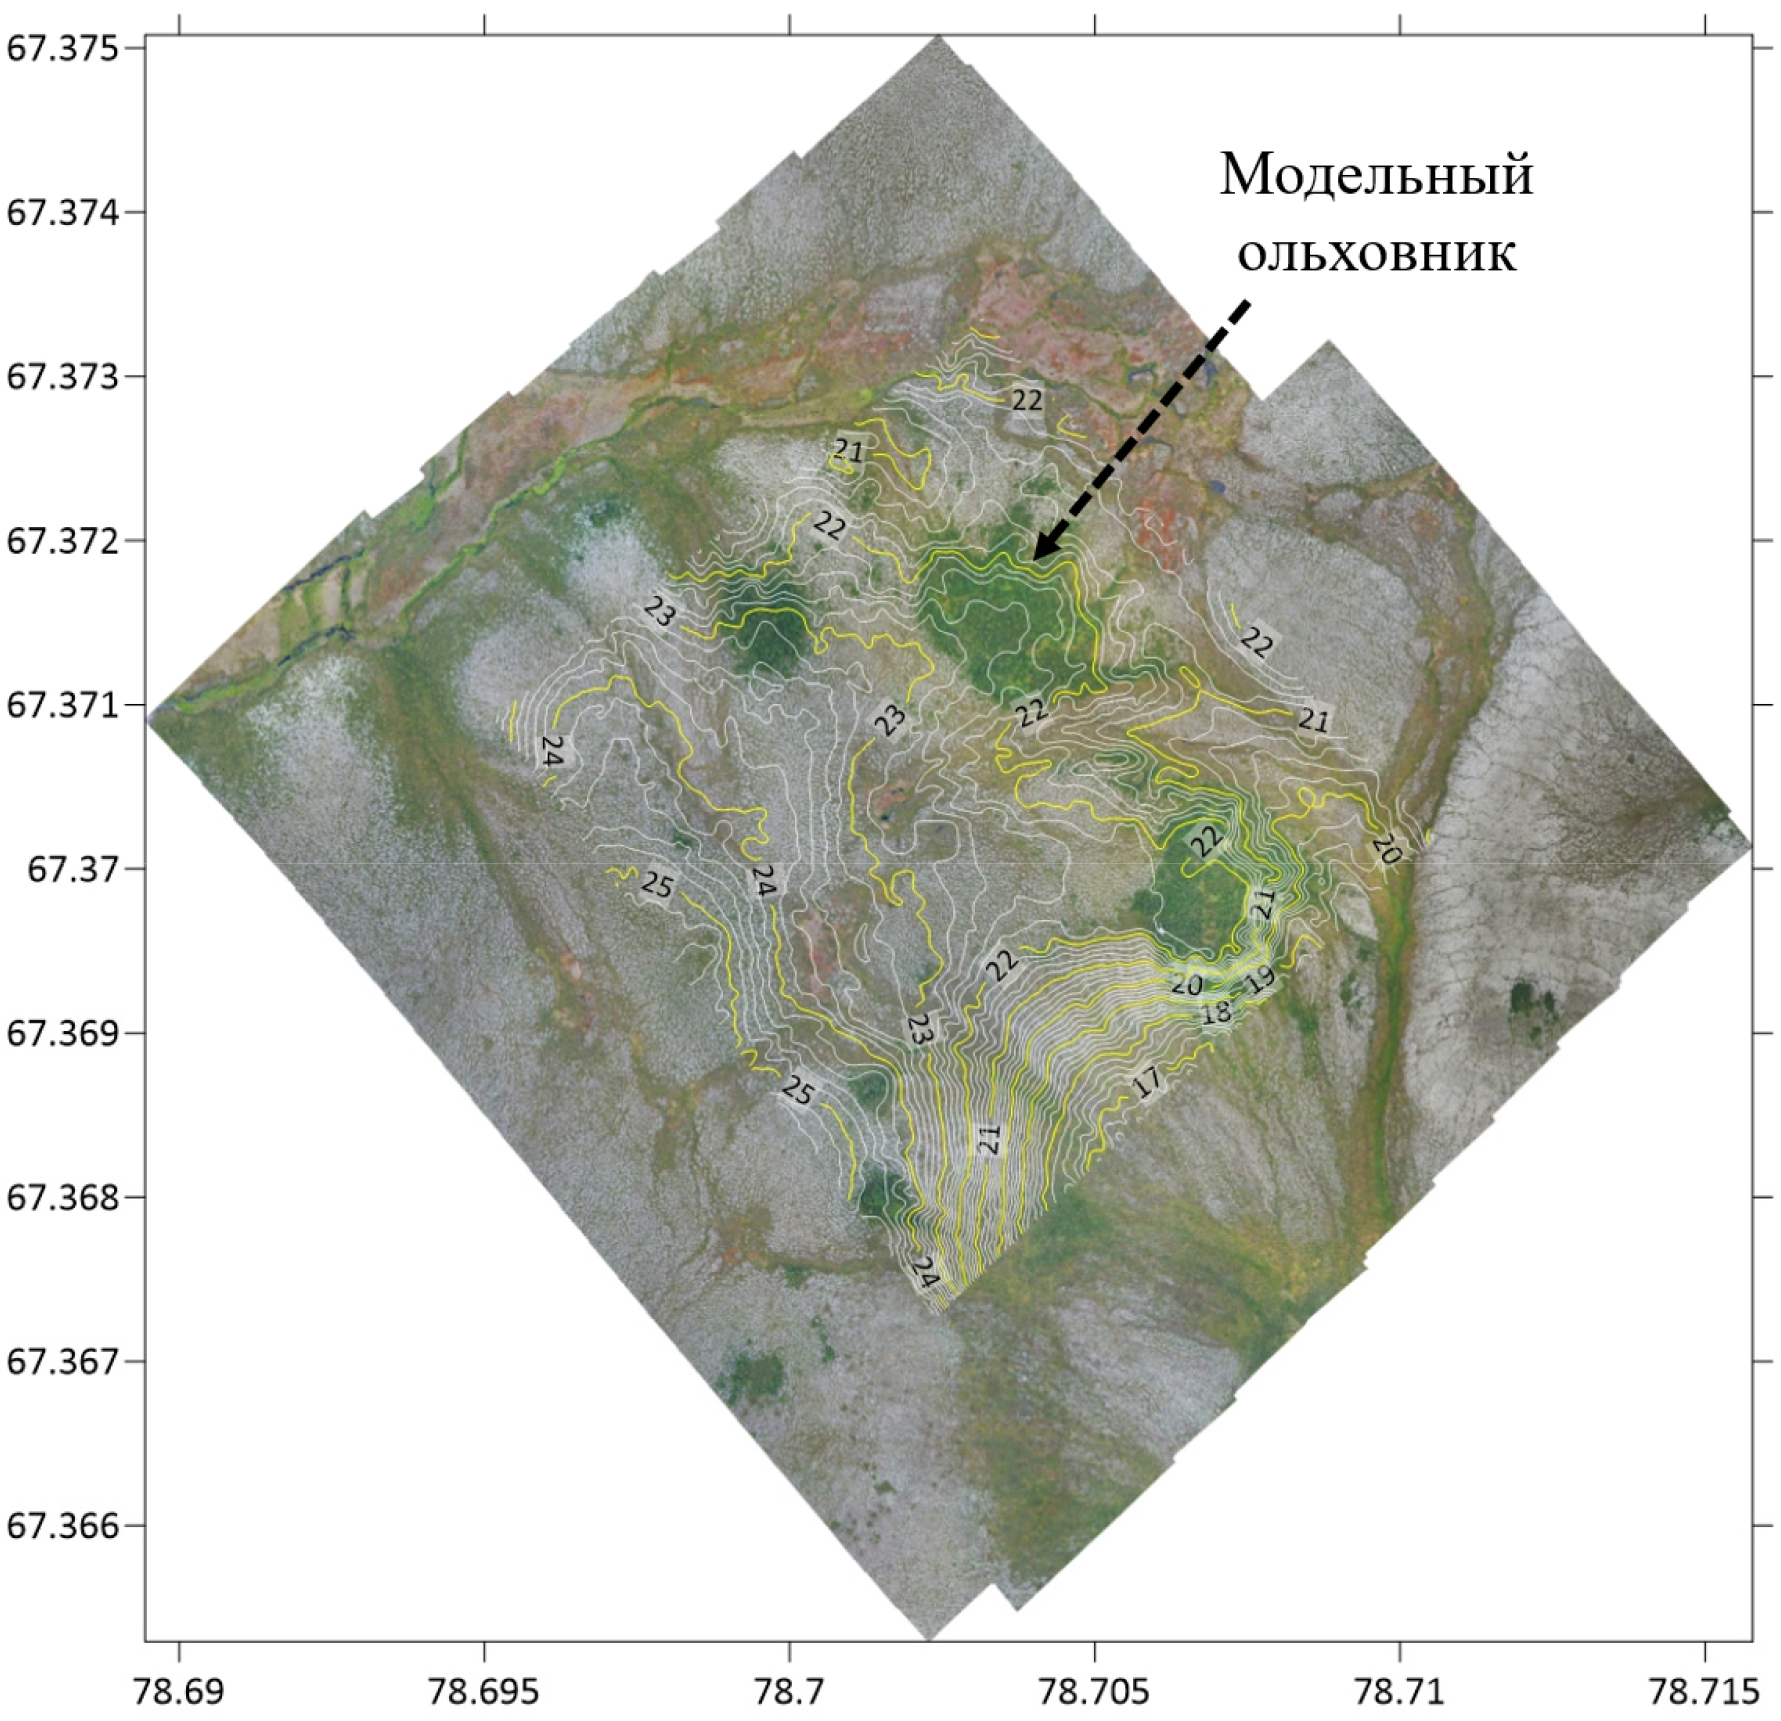
- Fig. 4. Contour lines of the digital elevation model and location of the model alder thicket. Contour interval is 0,2 m
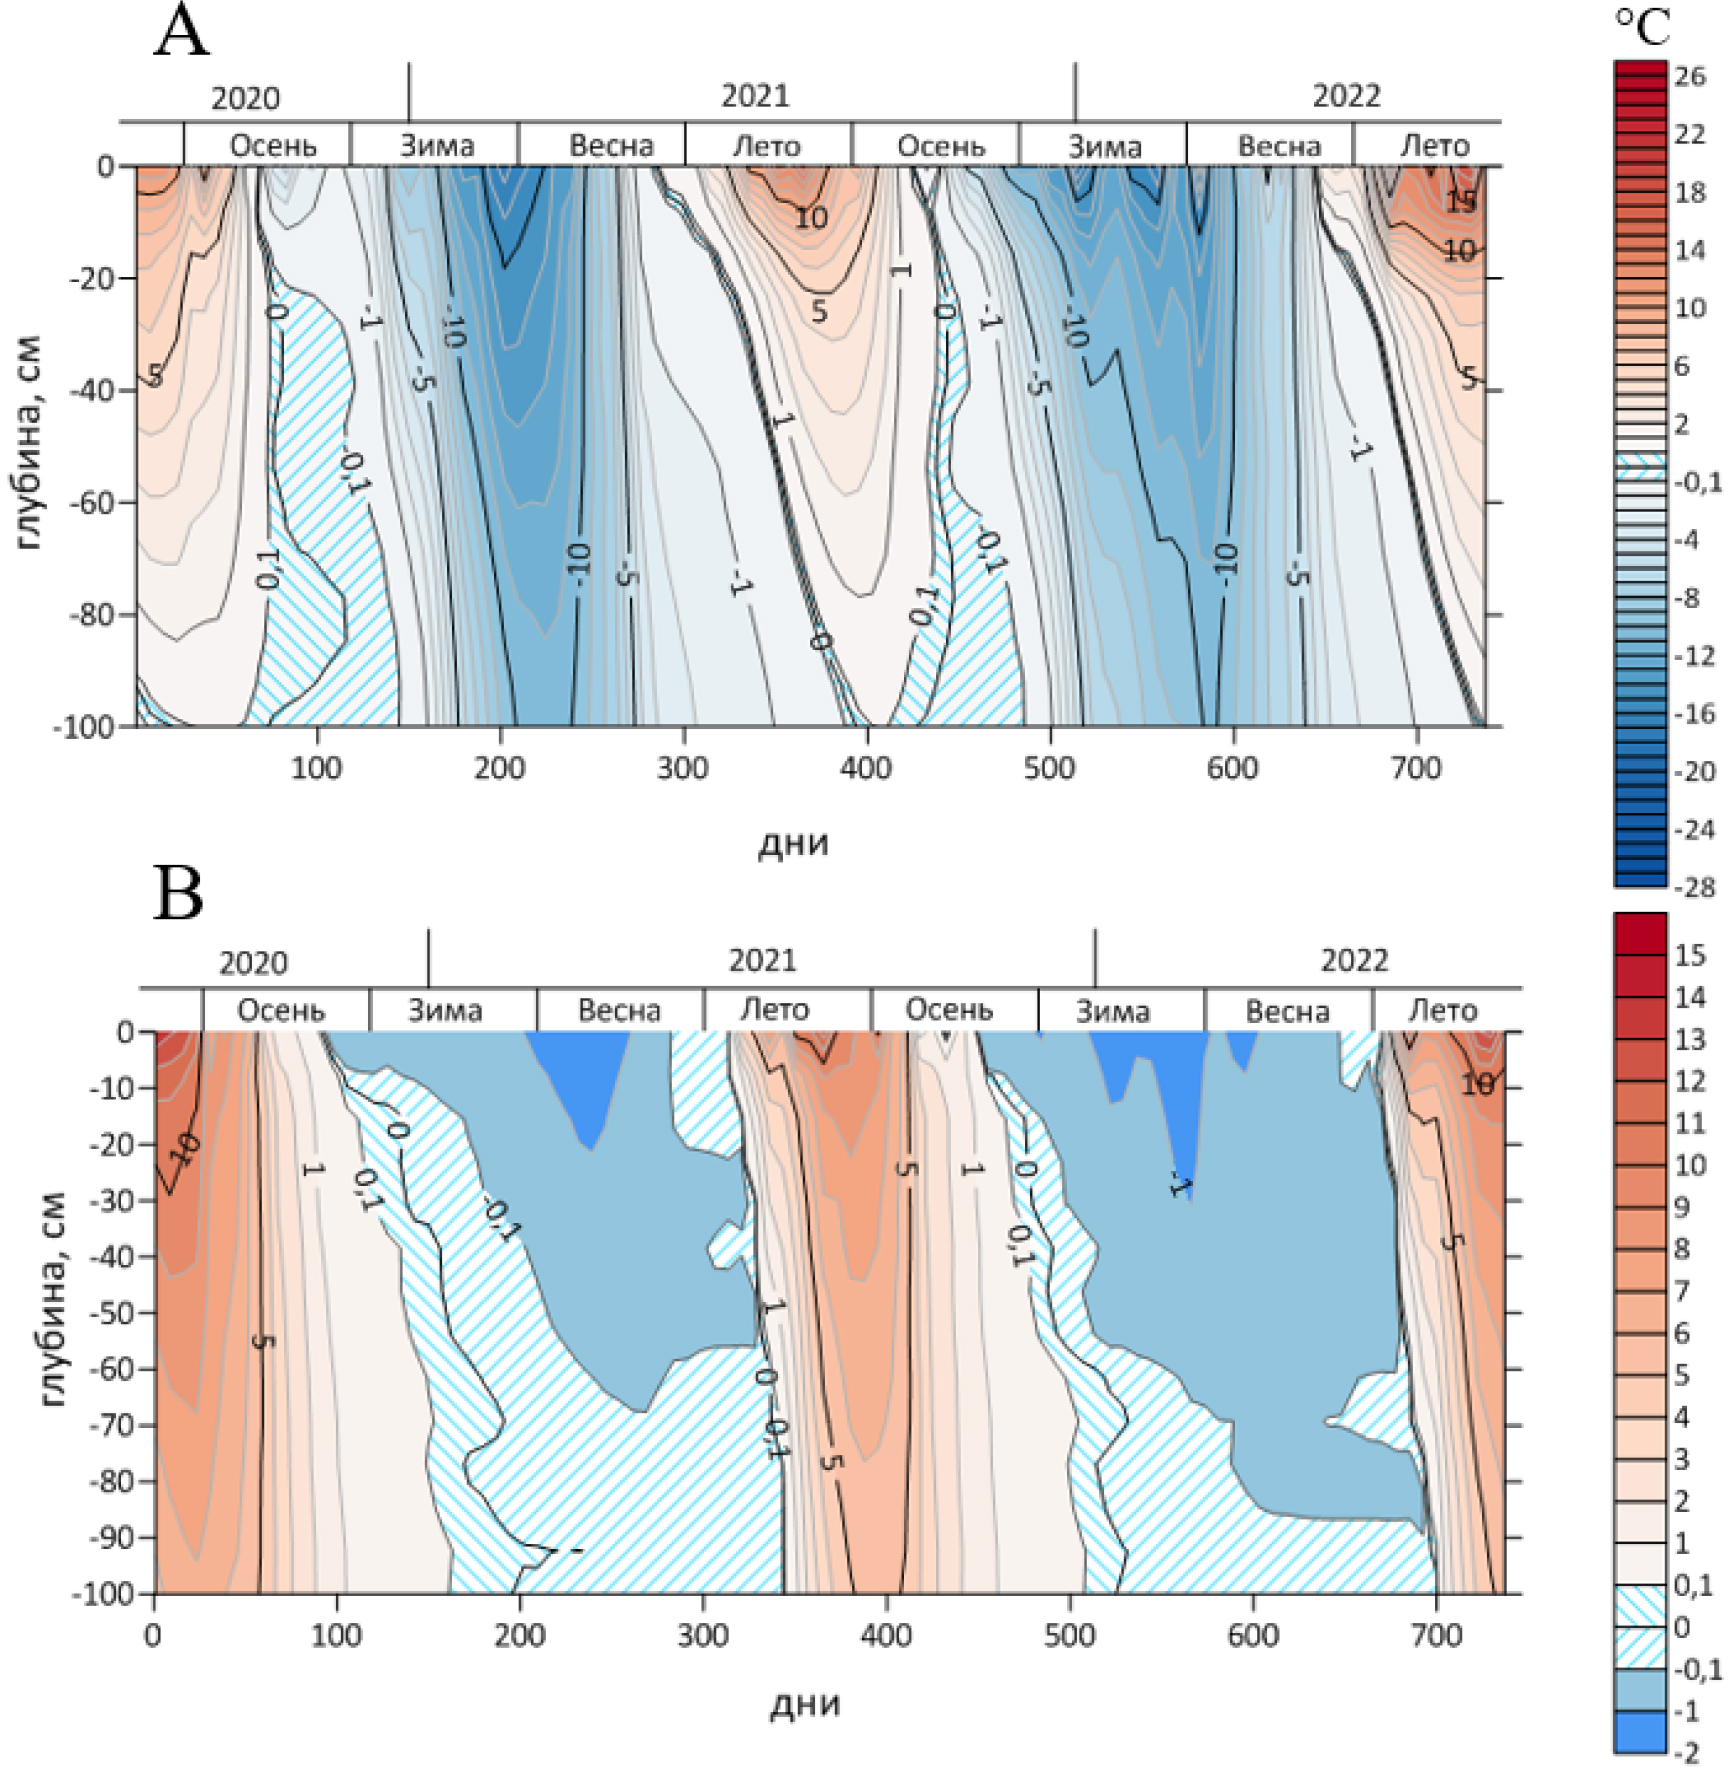
- Fig. 5. Thermo-isopleths of a Cryoturbated Gelic Gleysol in the background tundra (A) and a Gleyic Cryometamorphic soil under the model alder thicket on a meadow (B)
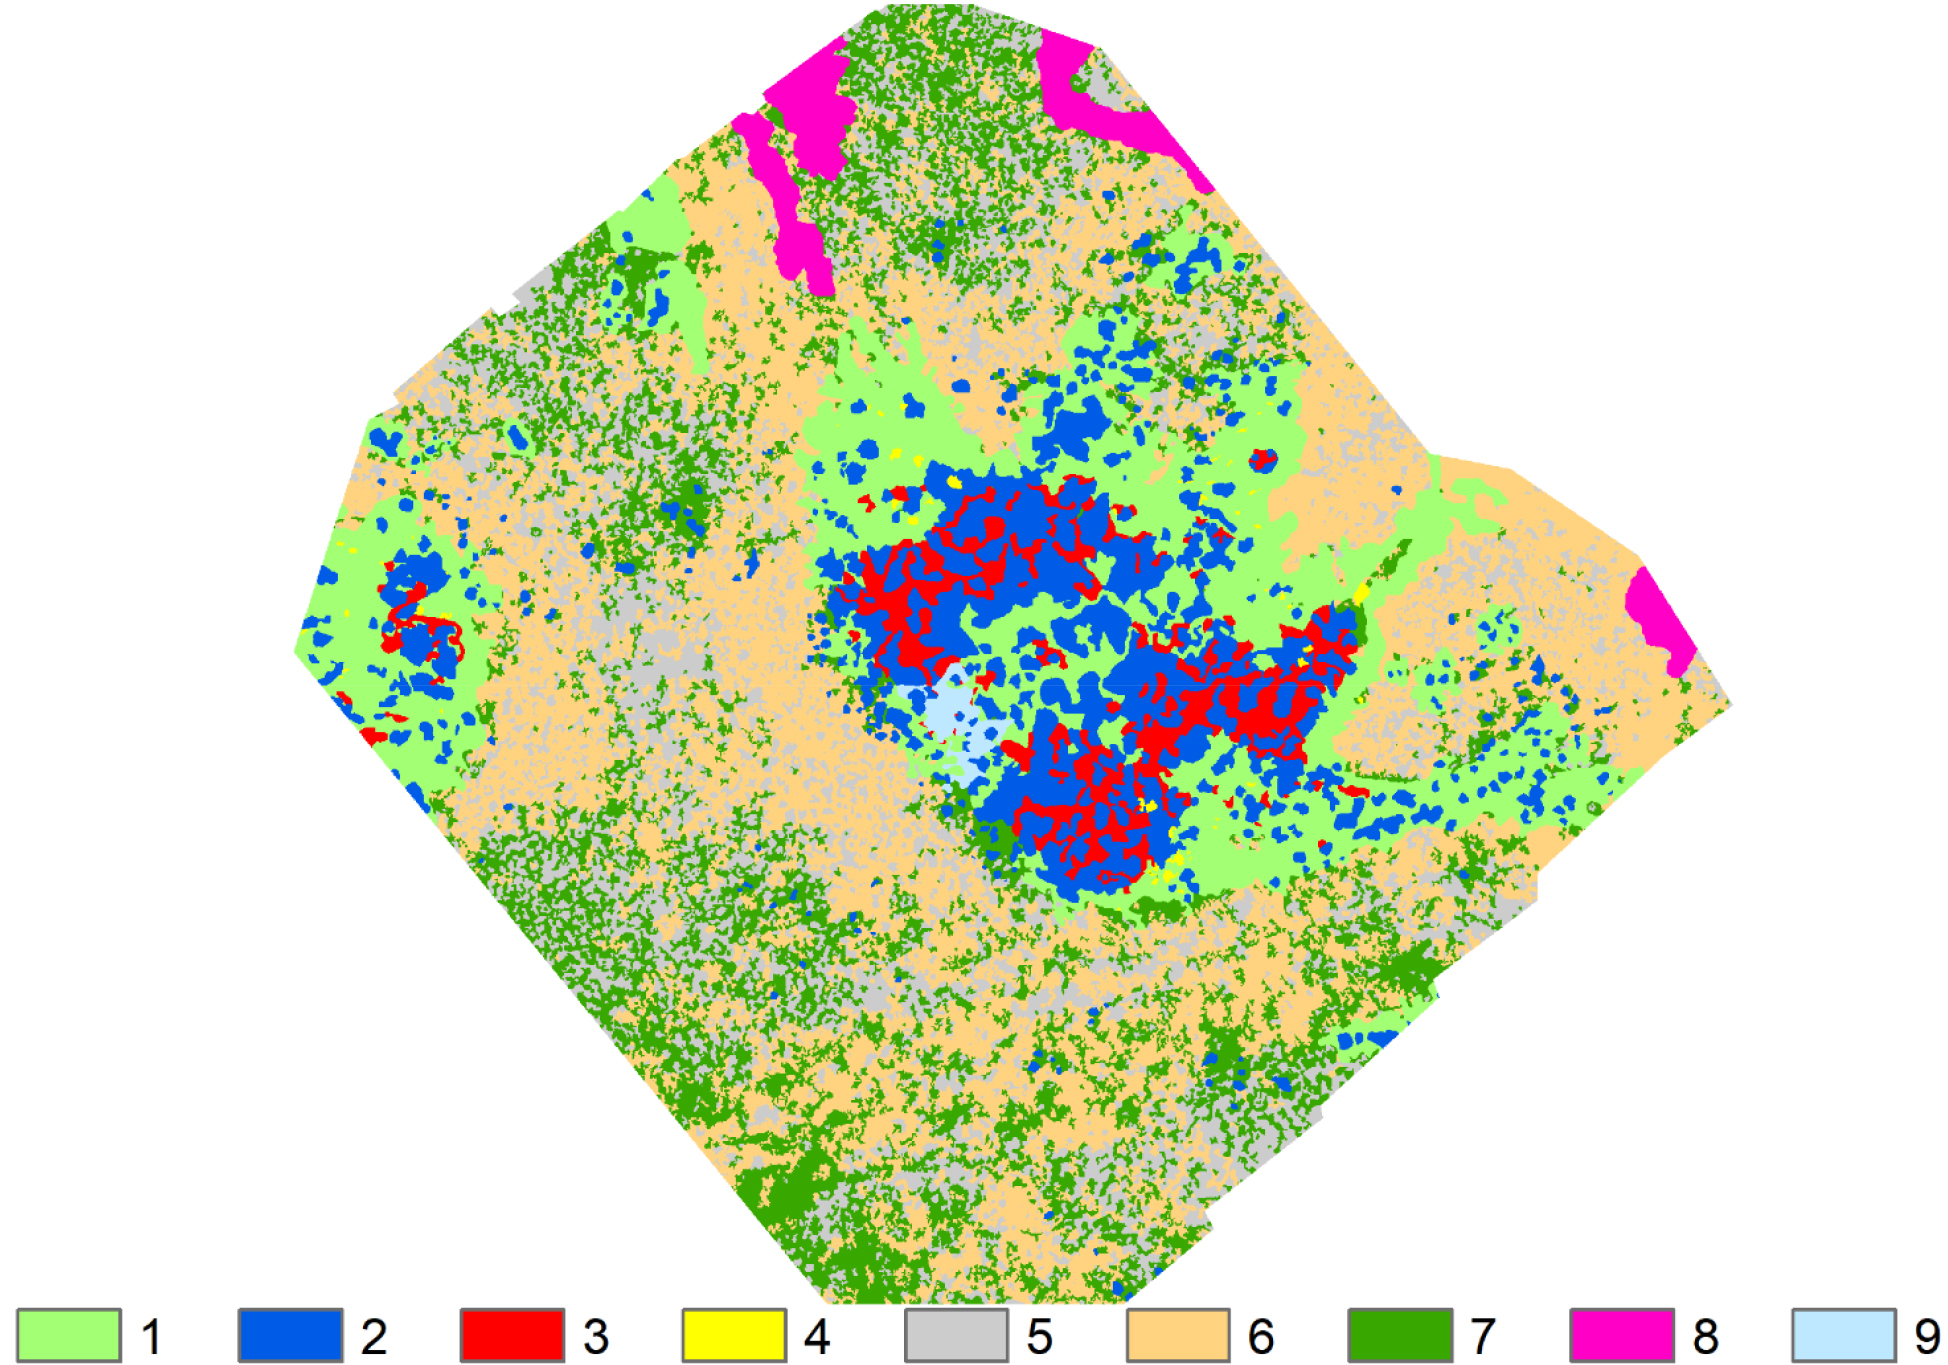
- Fig. 6. Scheme of the spatial structure of vegetation in the model alder thicket: 1 – dwarf birch stands; 2 – alder patches; 3 – Calamagrostis-sedge patches; 4 – willow patches; 5 – moss-dwarf shrub–lichen communities on micro-hummocks; 6 – lichen-green moss-Sphagnum communities with low height dwarf birch; 7 – medium-height dwarf birch stands outside the alder thicket; 8 – Sphagnum-filled depressions; 9 – dwarf birch-lichen communities with single alder thickets.
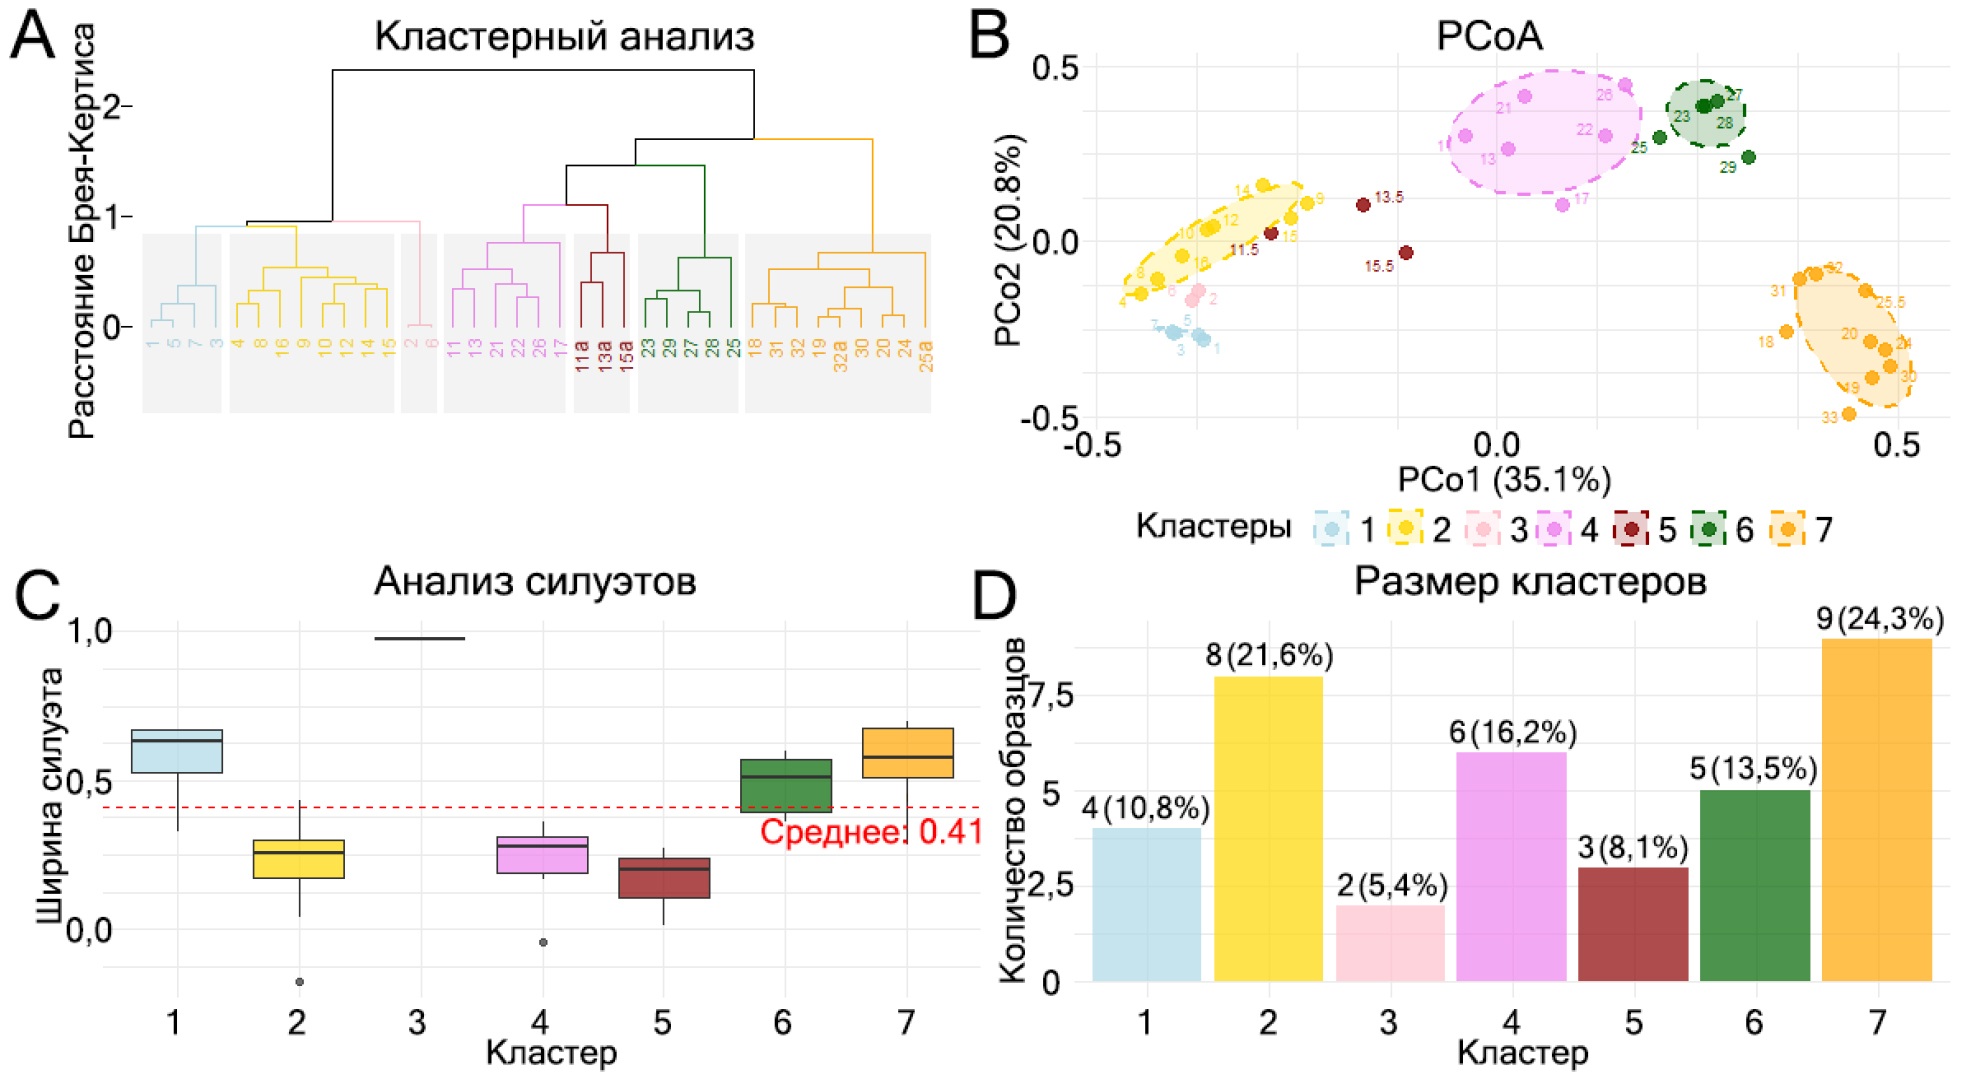
- Fig. 7. Analysis of the structure of plant communities. A – dendrogram of hierarchical clustering; B – ordination diagram (PCoA); C – plot of silhouette coefficients; D – plot comparing the size of the identified clusters
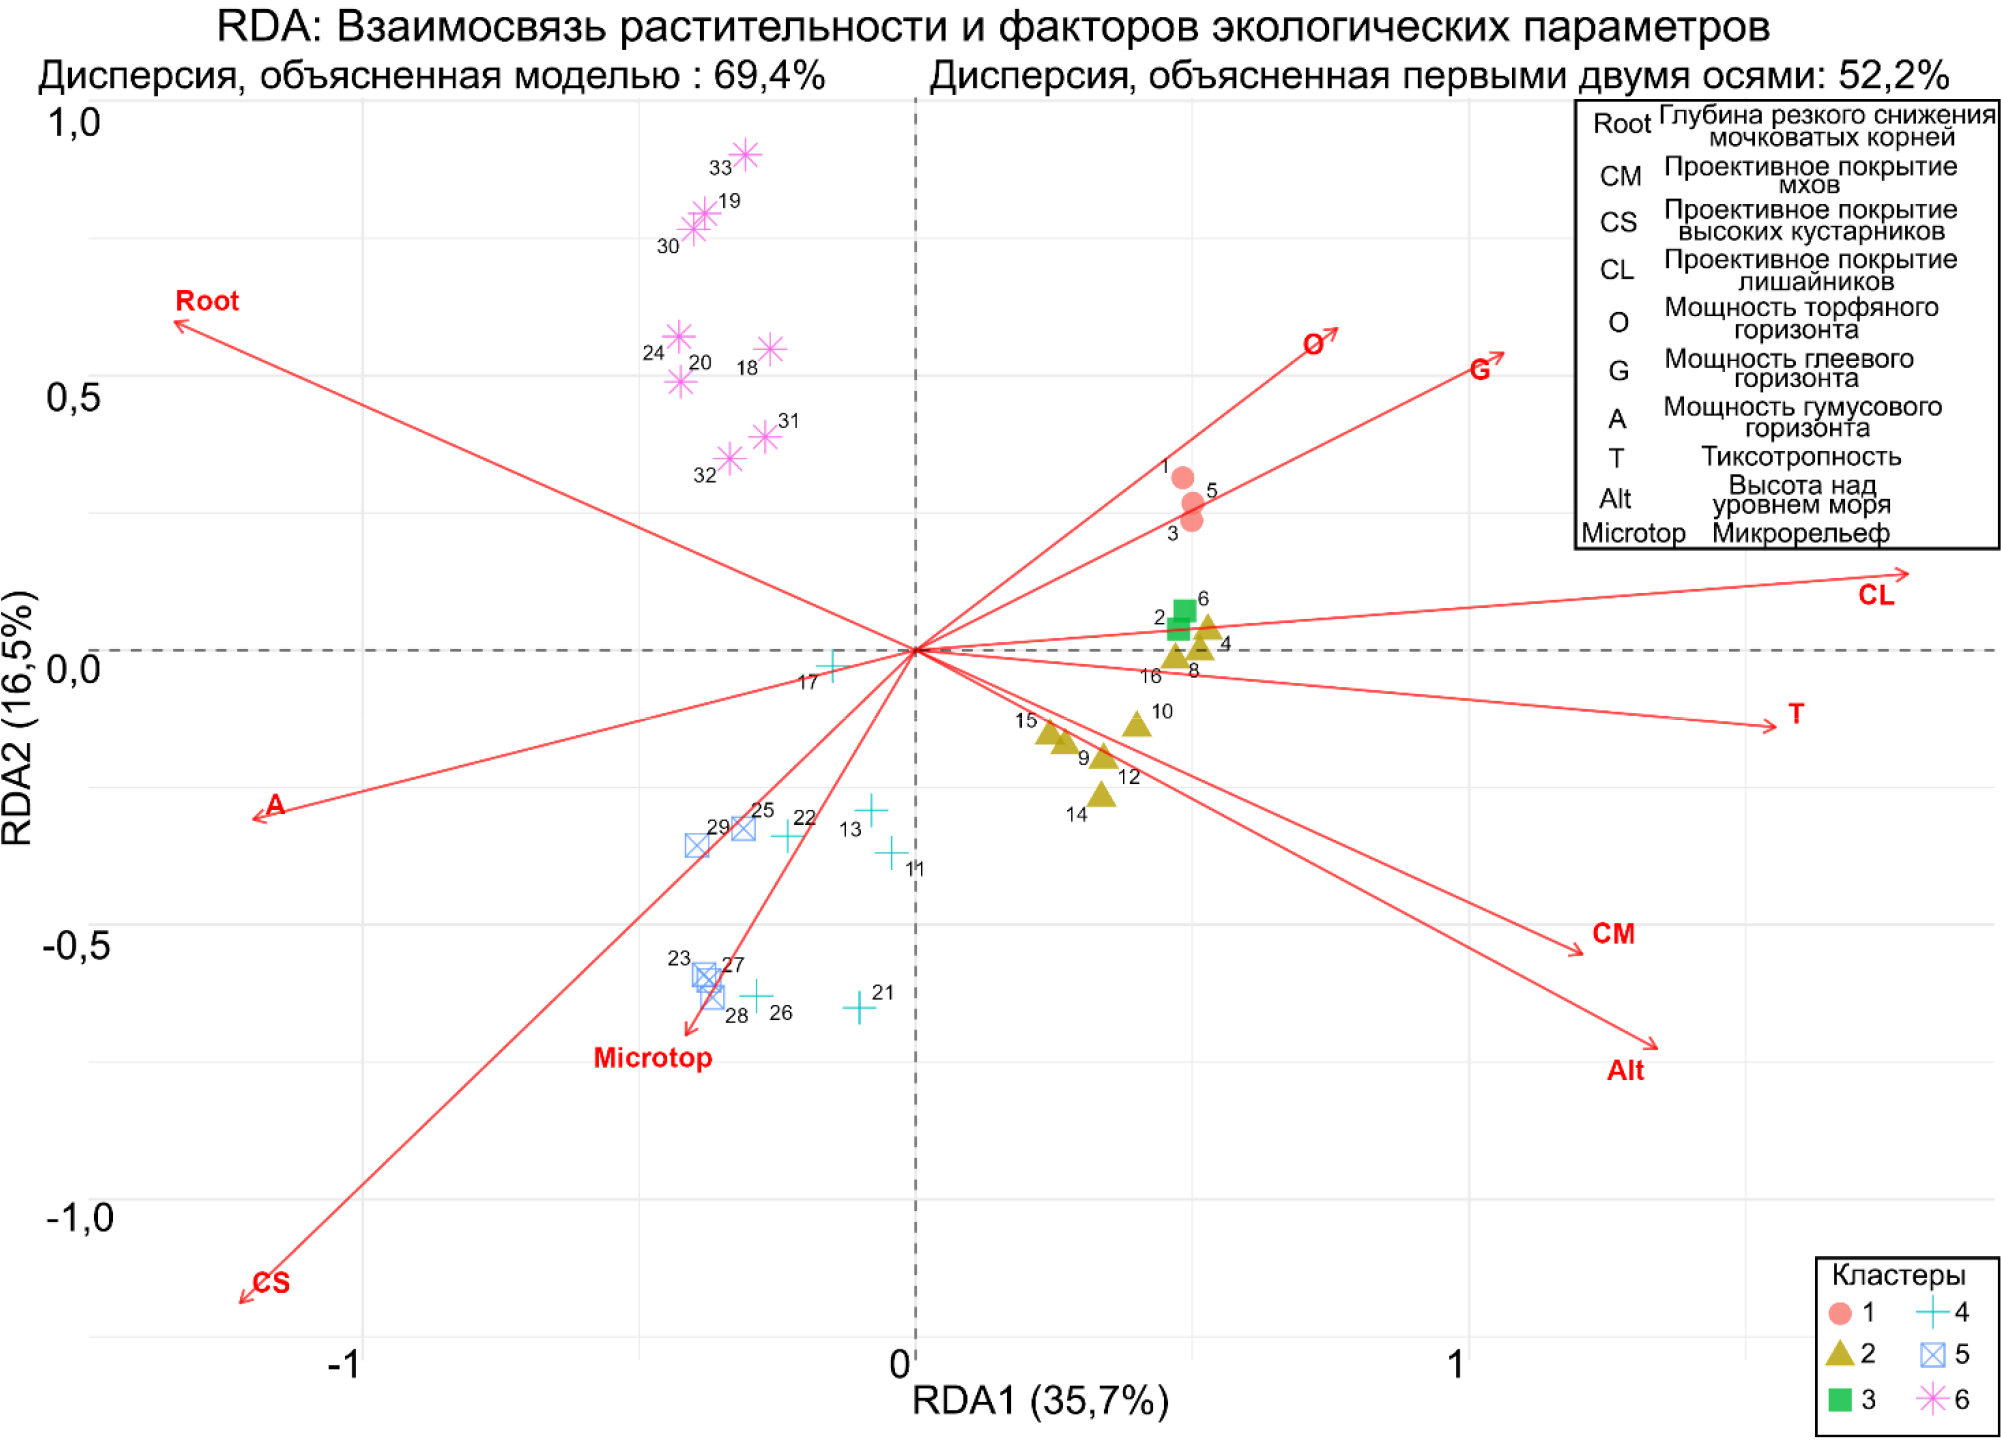
- Fig. 8. Ordination diagram of the redundancy analysis (RDA). Shapes correspond to 32 geobotanical descriptions grouped by clusters. Red vectors indicate axes of environmental parameters
Copyright © 2016 RJEE. THE ONLINE EDITION IS REGISTERED IN THE FEDERAL SERVICE FOR SUPERVISION OF COMMUNICATIONS, INFORMATION TECHNOLOGY, AND MASS MEDIA. REGISTRATION CERTIFICATE № FS 77 – 62950 from 04.09.2015.