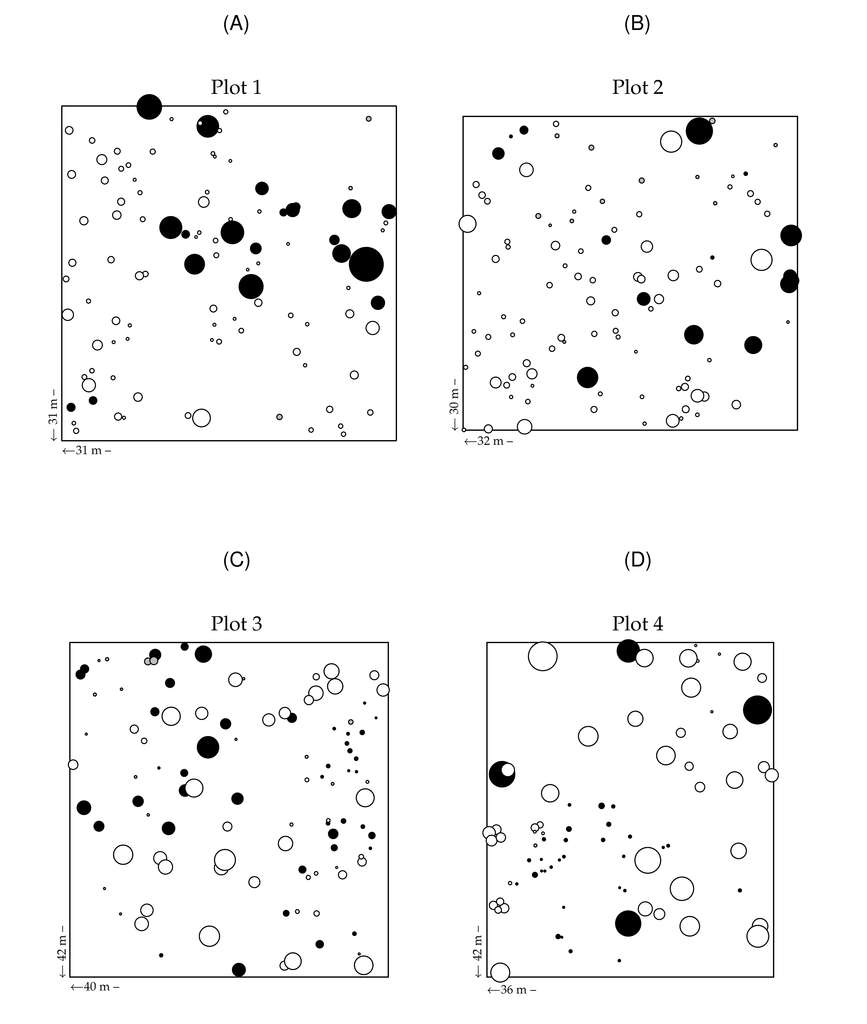
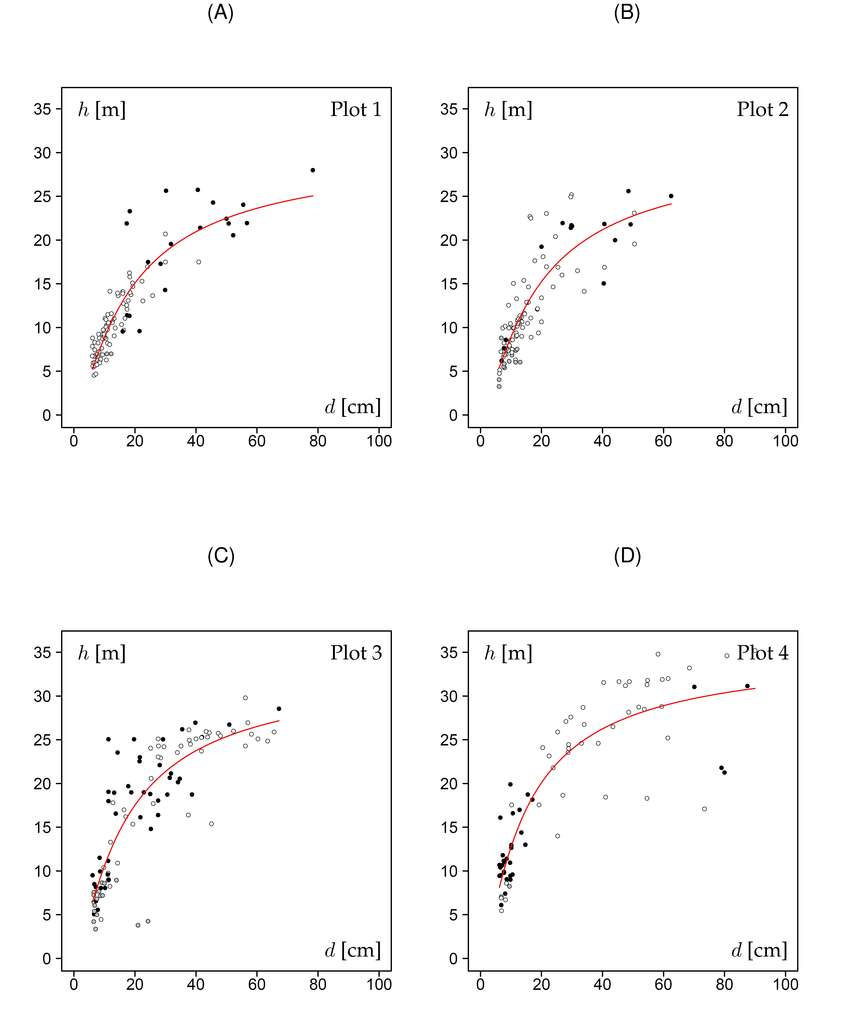
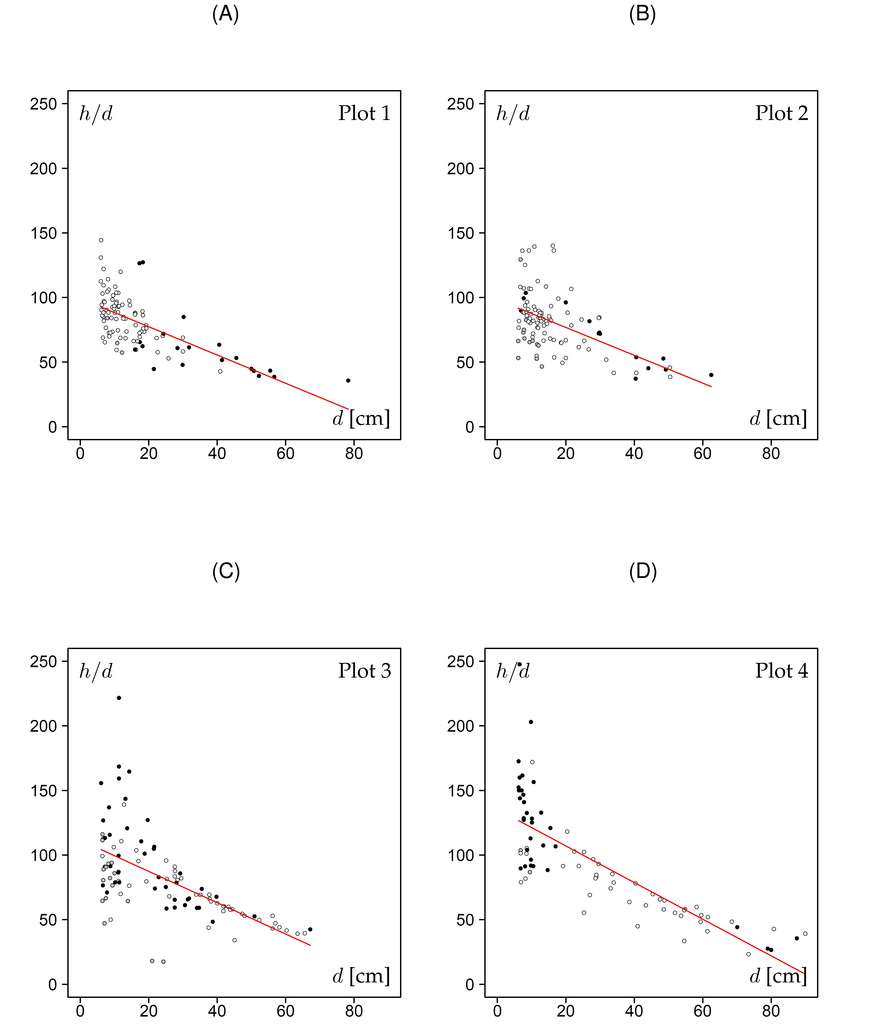
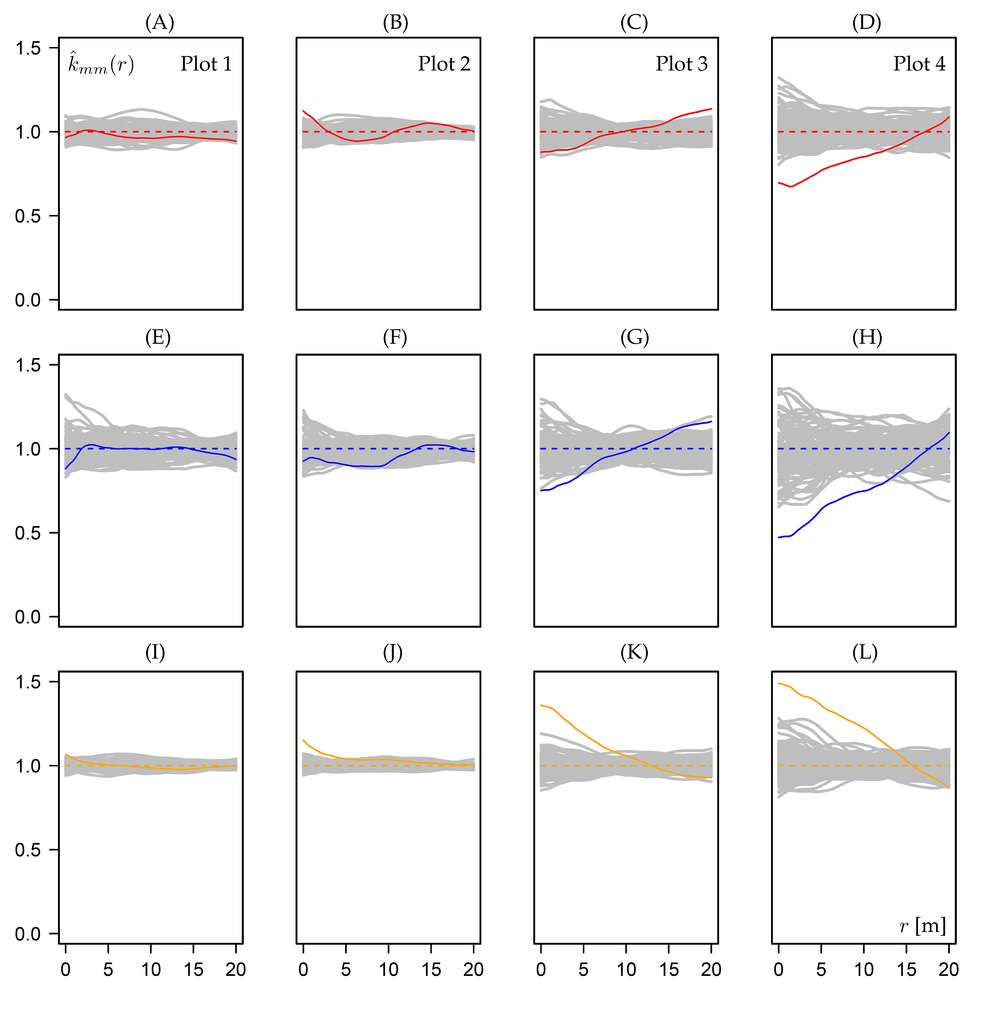
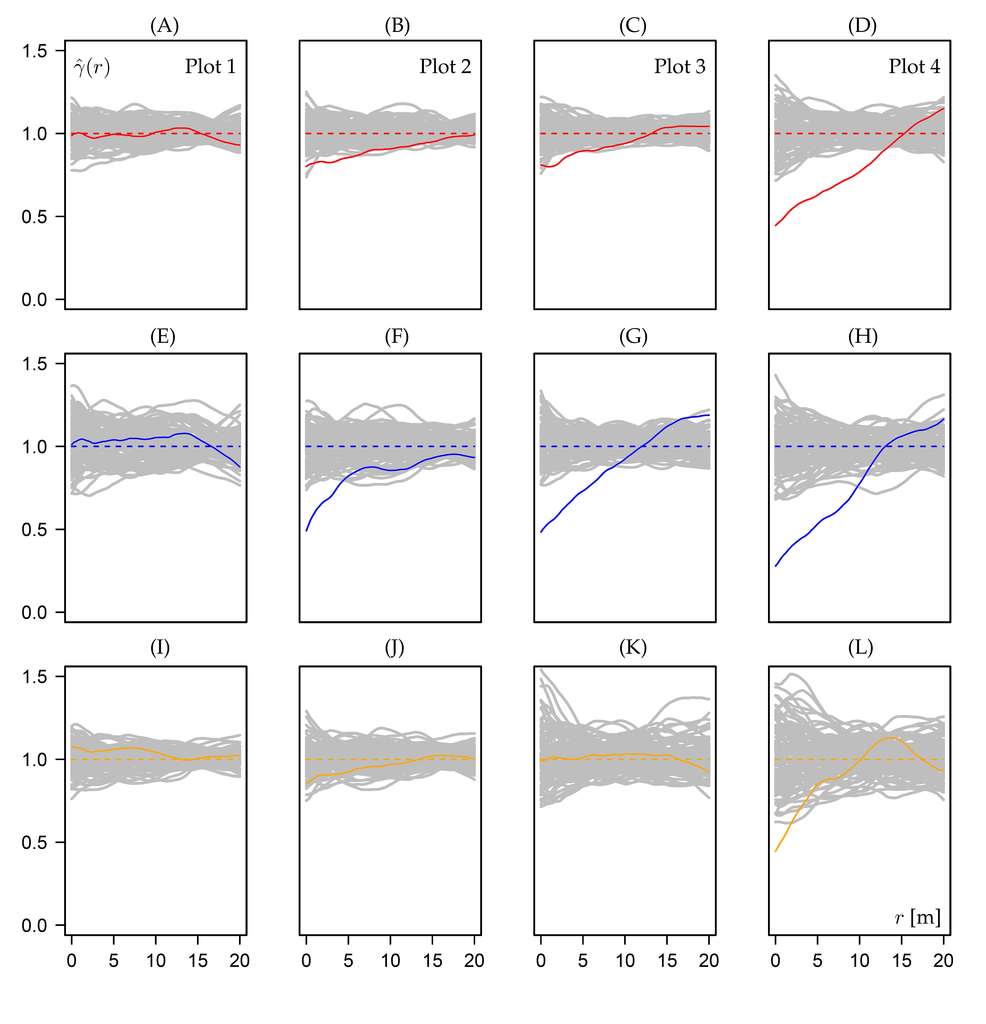
Дополнительные файлы [RJEE Vol. 3 (2). 2018 – 1] Fig. 1. Maps of the four plots sampled in Lligwy Woods in 2008 Fig. 2. The two quantitative marks tree stem diameter, d, and total tree height Fig. 3. Scatterplots of the height-diameter ratio, h d (slenderness), over tree stem diameter Fig. 4. Mark correlation function Fig. 5. Mark variogram


