


- Fig. 1. Correlation of regularity and complexity as characteristics of systems (according to [10] with changes). A nonlinear correlation indicates the formation of simple systems with high regularity and high irregularity and the formation of complex systems with an average level of regularity. Below the graph, examples of the system state in terms of space (top row), structure (middle row) and dynamics (bottom row) are schematically shown.
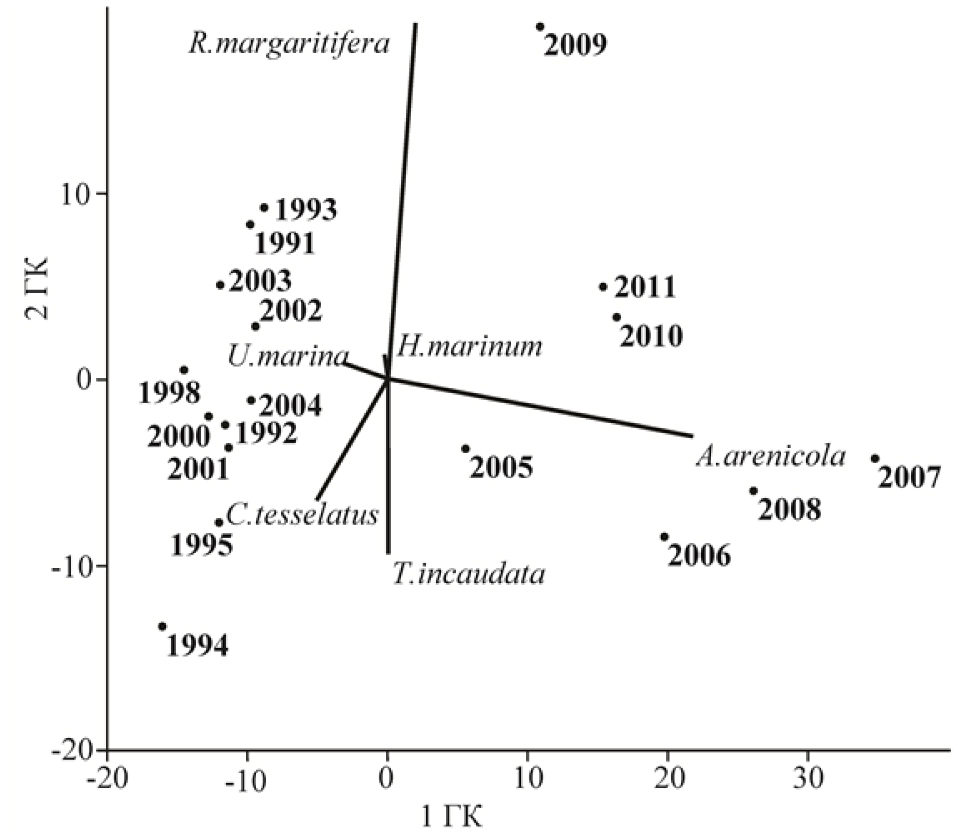
- Fig. 2. Results of communities’ ordination by the principal component method based on the relative abundances of the first six dominant species: 1 PC – the first principal component (explains 71.2% of the total variability of the community); 2 PC – the second principal component (15.8%)
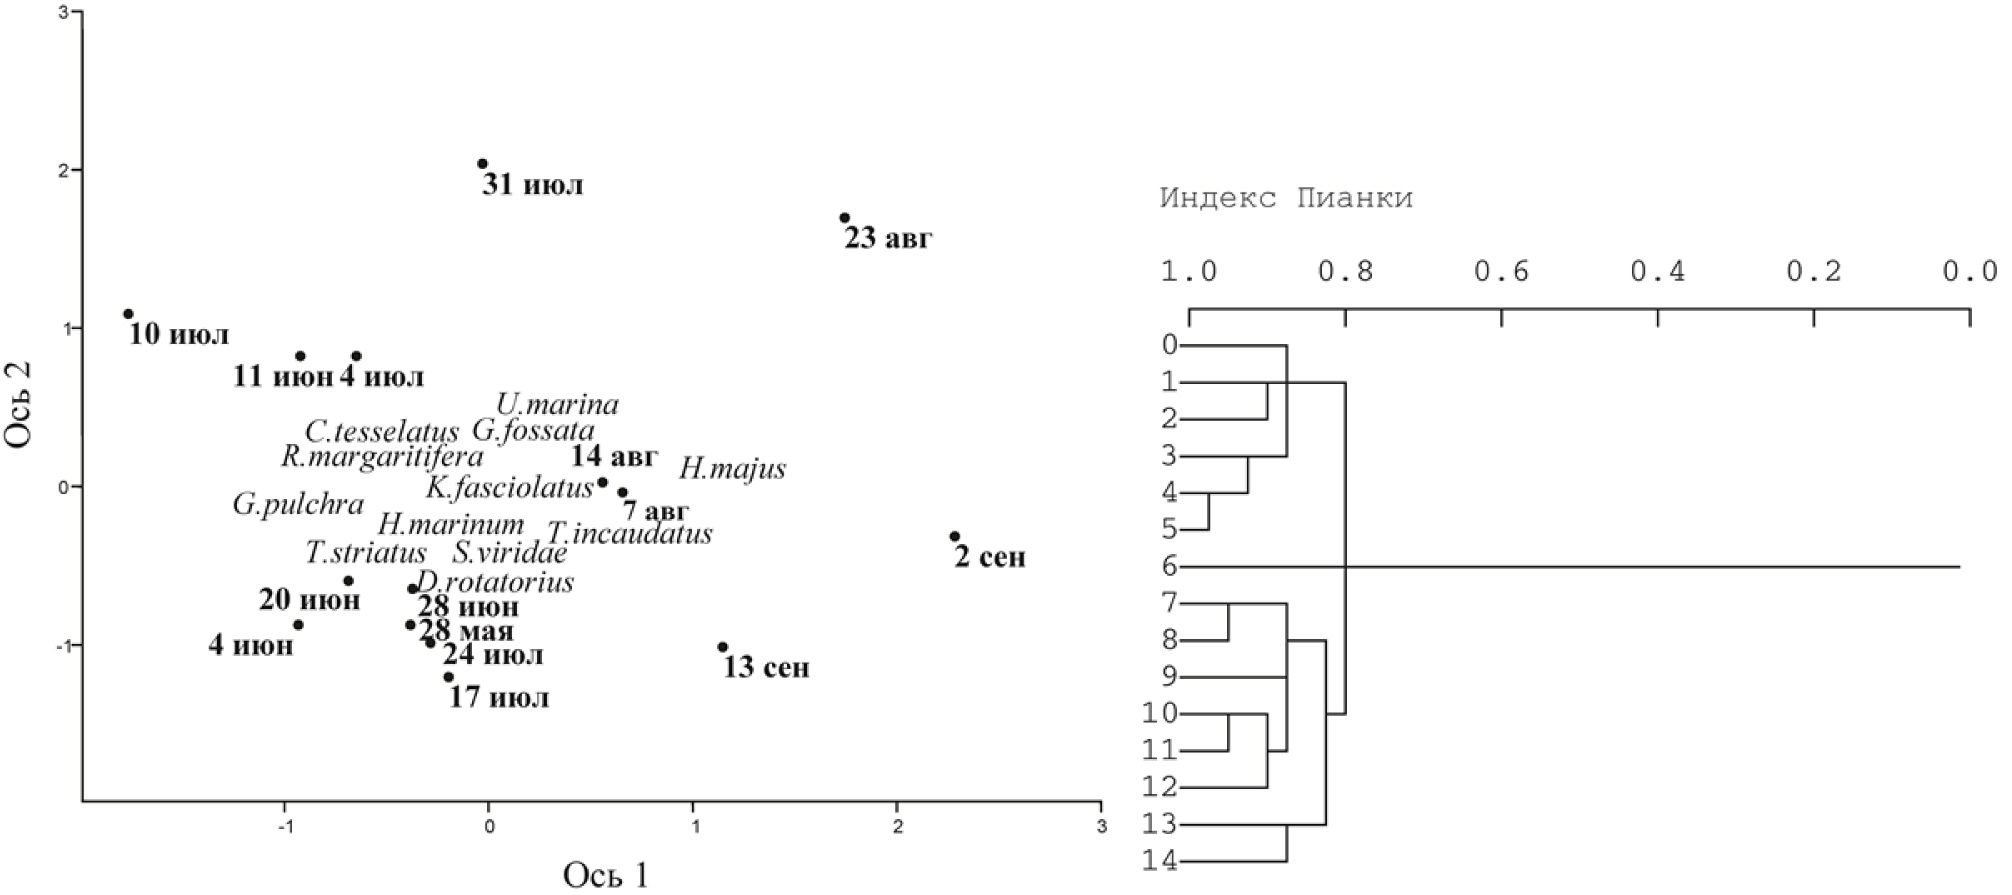
- Fig. 3. Results of ordination of (a) dominant species by the method of correspondence analysis and sequential cluster analysis (b) of temporal states of the community (0–14 are consecutive sampling dates) according to 1992 data.
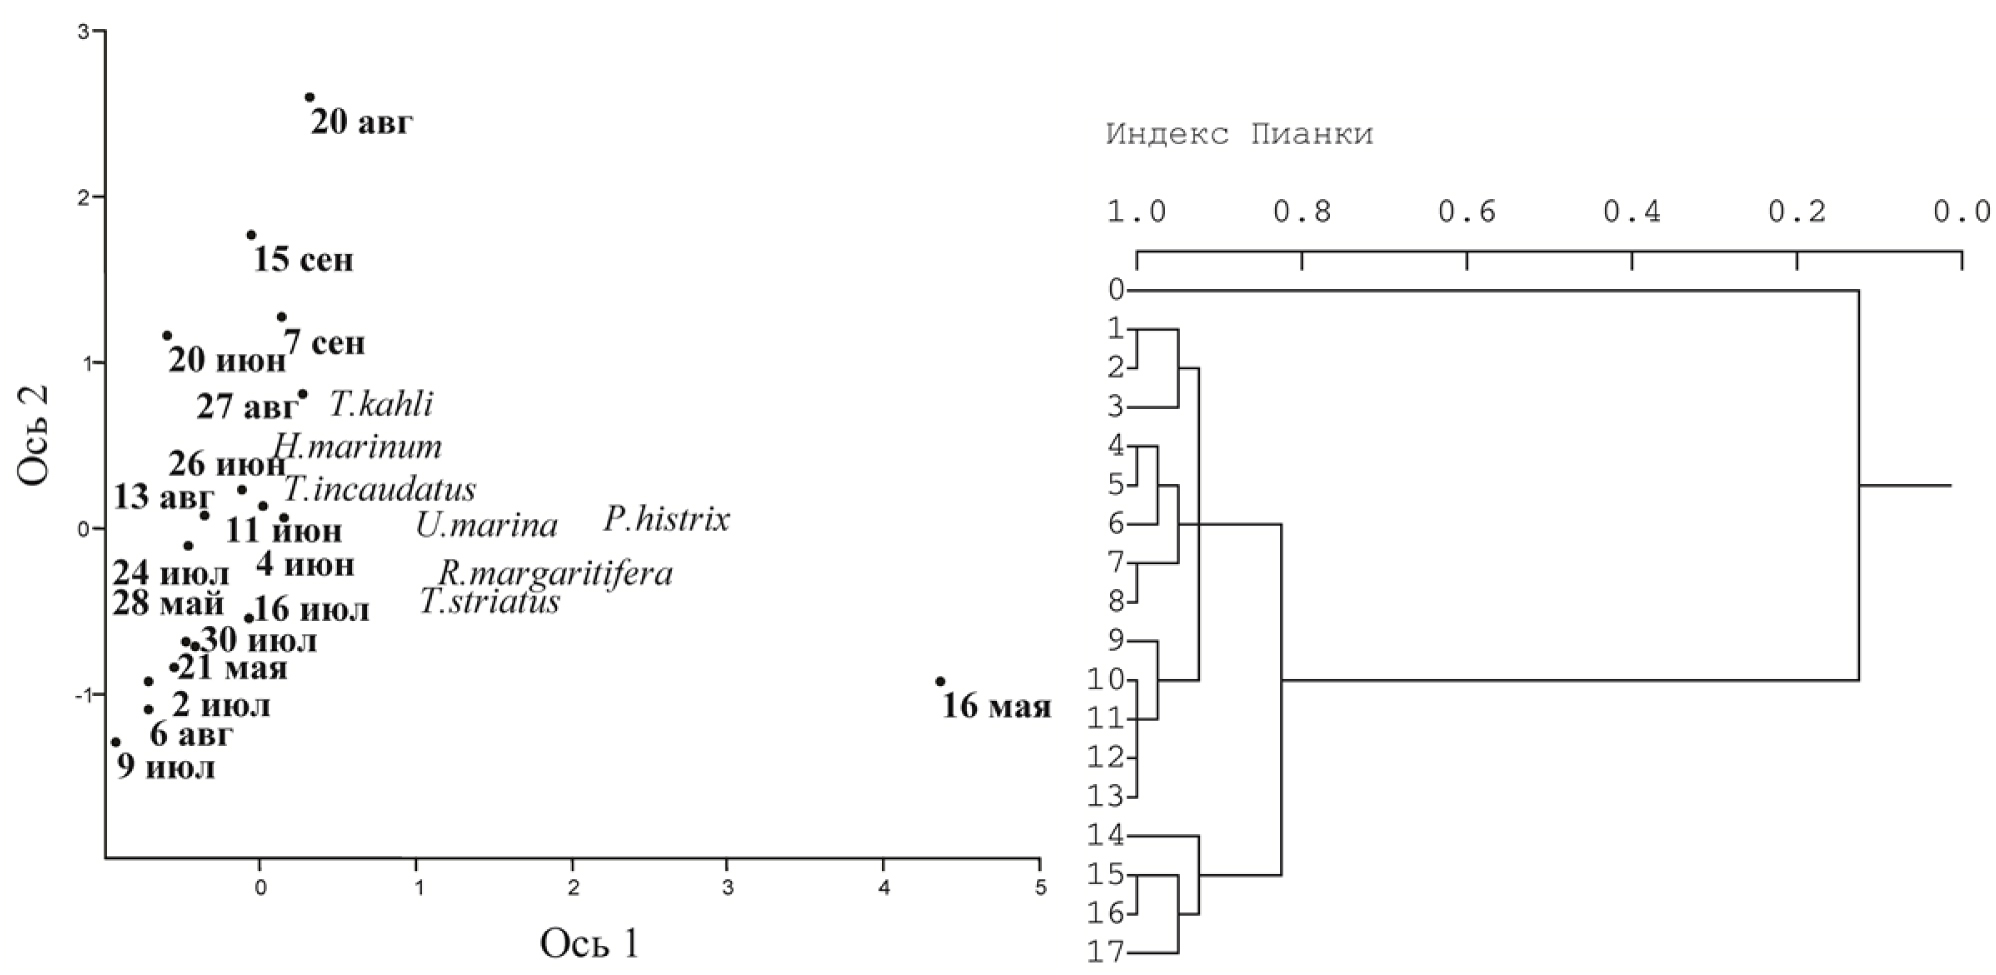
- Fig. 4. Results of ordination of (a) dominant species by the method of correspondence analysis and sequential cluster analysis (b) of temporal states of the community (0–17 – consecutive sampling dates) according to 2007 data.
![Fig. 1. Correlation of regularity and complexity as characteristics of systems (according to [10] with changes). A nonlinear correlation indicates the formation of simple systems with high regularity and high irregularity and the formation of complex systems with an average level of regularity. Below the graph, examples of the system state in terms of space (top row), structure (middle row) and dynamics (bottom row) are schematically shown.](http://rjee.ru/wp-content/uploads/2016/03/Бурковский-Мазей-рис1.jpg)
Copyright © 2016 RJEE. THE ONLINE EDITION IS REGISTERED IN THE FEDERAL SERVICE FOR SUPERVISION OF COMMUNICATIONS, INFORMATION TECHNOLOGY, AND MASS MEDIA. REGISTRATION CERTIFICATE № FS 77 – 62950 from 04.09.2015.