


- Fig. 1. The layout of the mesocosms
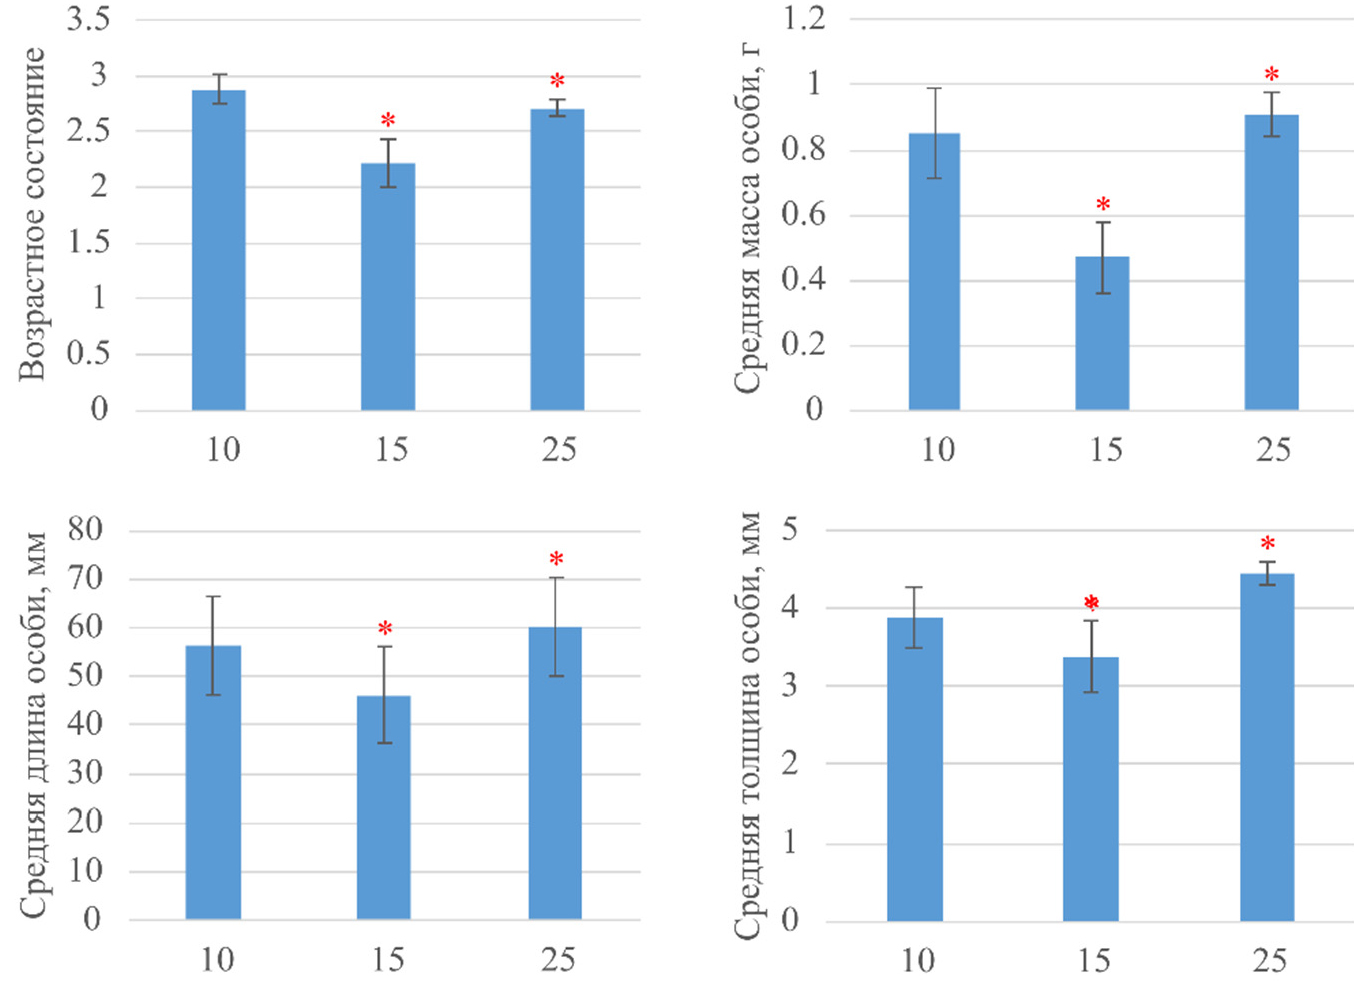
- Fig. 2. The size and weight of individuals depending on the diameter of the mesocosm (cm): the abscissa axis indicates the diameter of the mesocosm, * – there is a significant difference between the columns according to the Tukey’s test (p < 0.05); the whiskers indicate the standard error
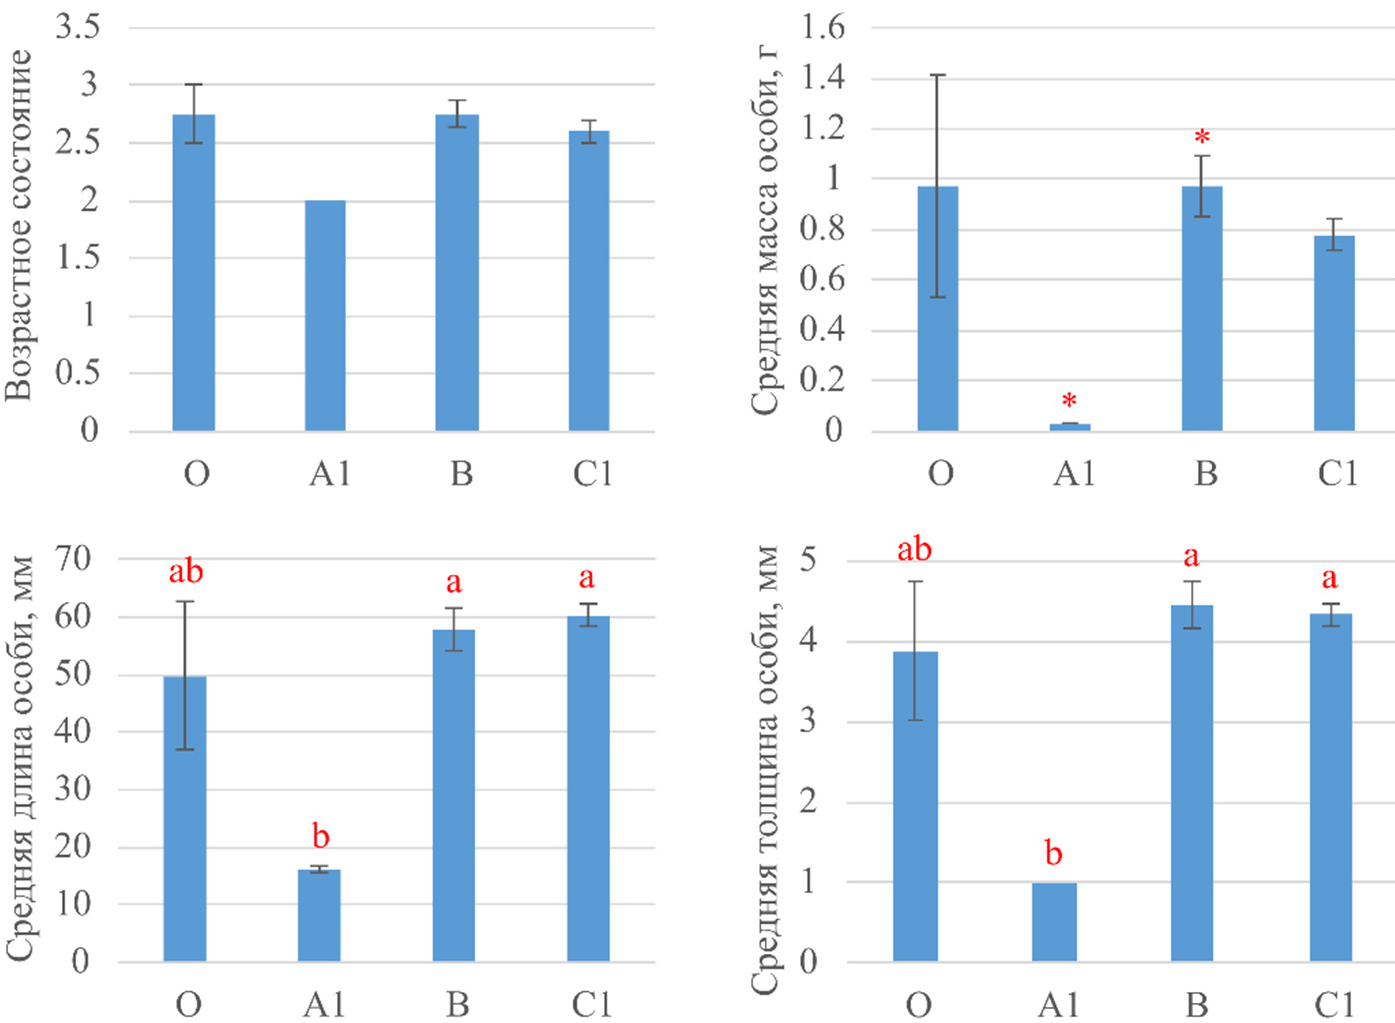
- Fig. 3. Individual indicators depending on the soil horizon: the abscissa axis indicates the soil horizons; * – there is a significant difference between the columns according to the Tukey’s test (p < 0.05); different lowercase letters (a, b) above the columns indicate significantly different groups; whiskers indicate the standard error
Copyright © 2016 RJEE. THE ONLINE EDITION IS REGISTERED IN THE FEDERAL SERVICE FOR SUPERVISION OF COMMUNICATIONS, INFORMATION TECHNOLOGY, AND MASS MEDIA. REGISTRATION CERTIFICATE № FS 77 – 62950 from 04.09.2015.