


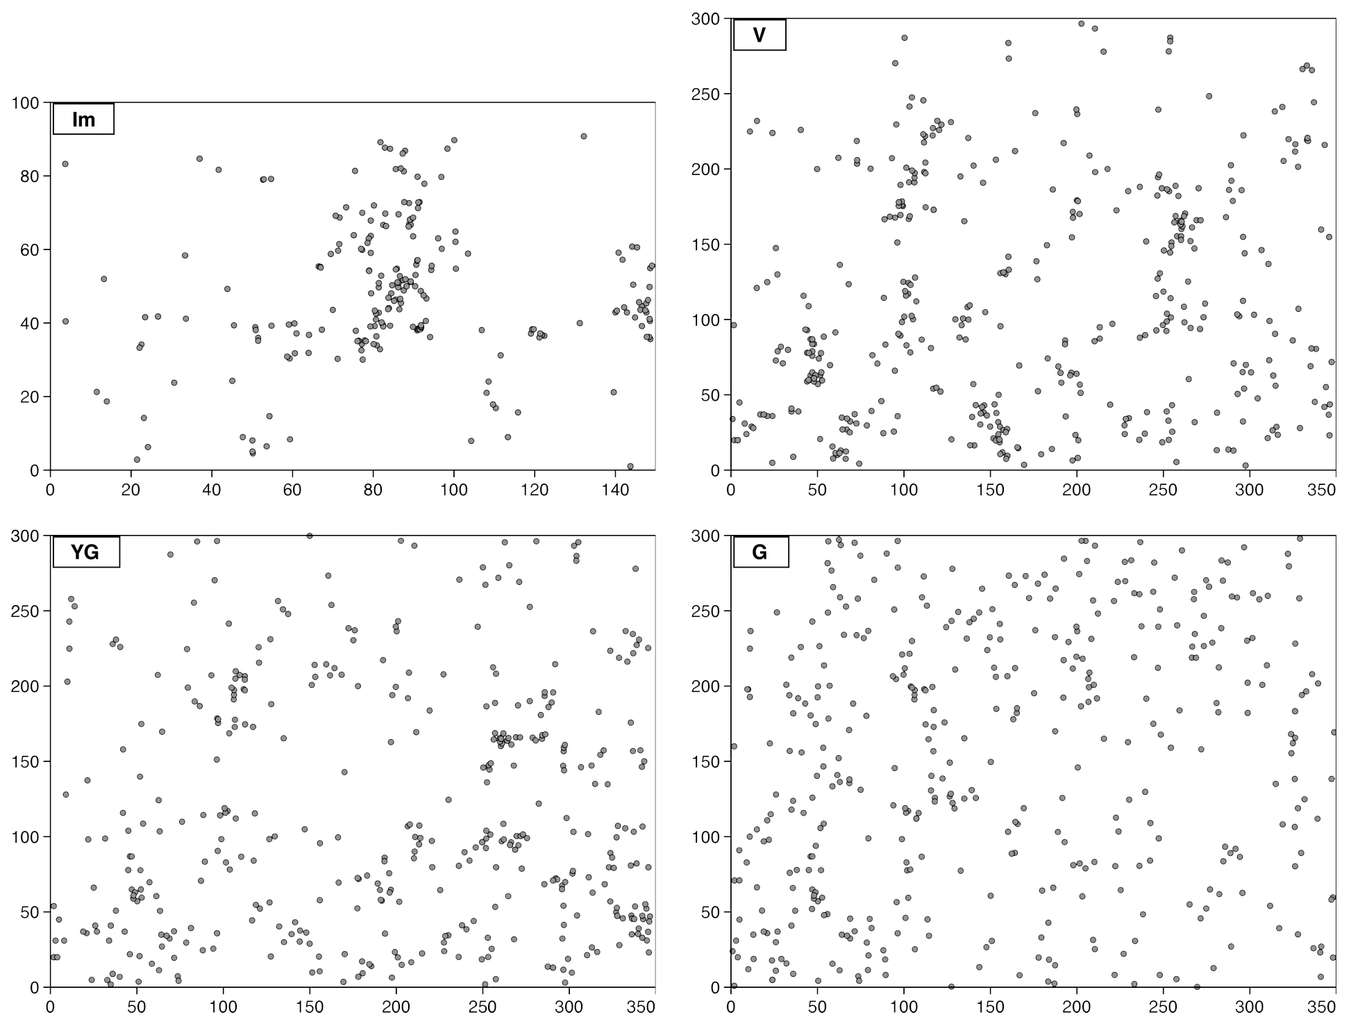
- Fig. 1. Location of Tilia amurensis species within the permanent trial plots а – im1 + im2 + im3; б – v1 + v2; в – v3 + g1; г – g2 + g3
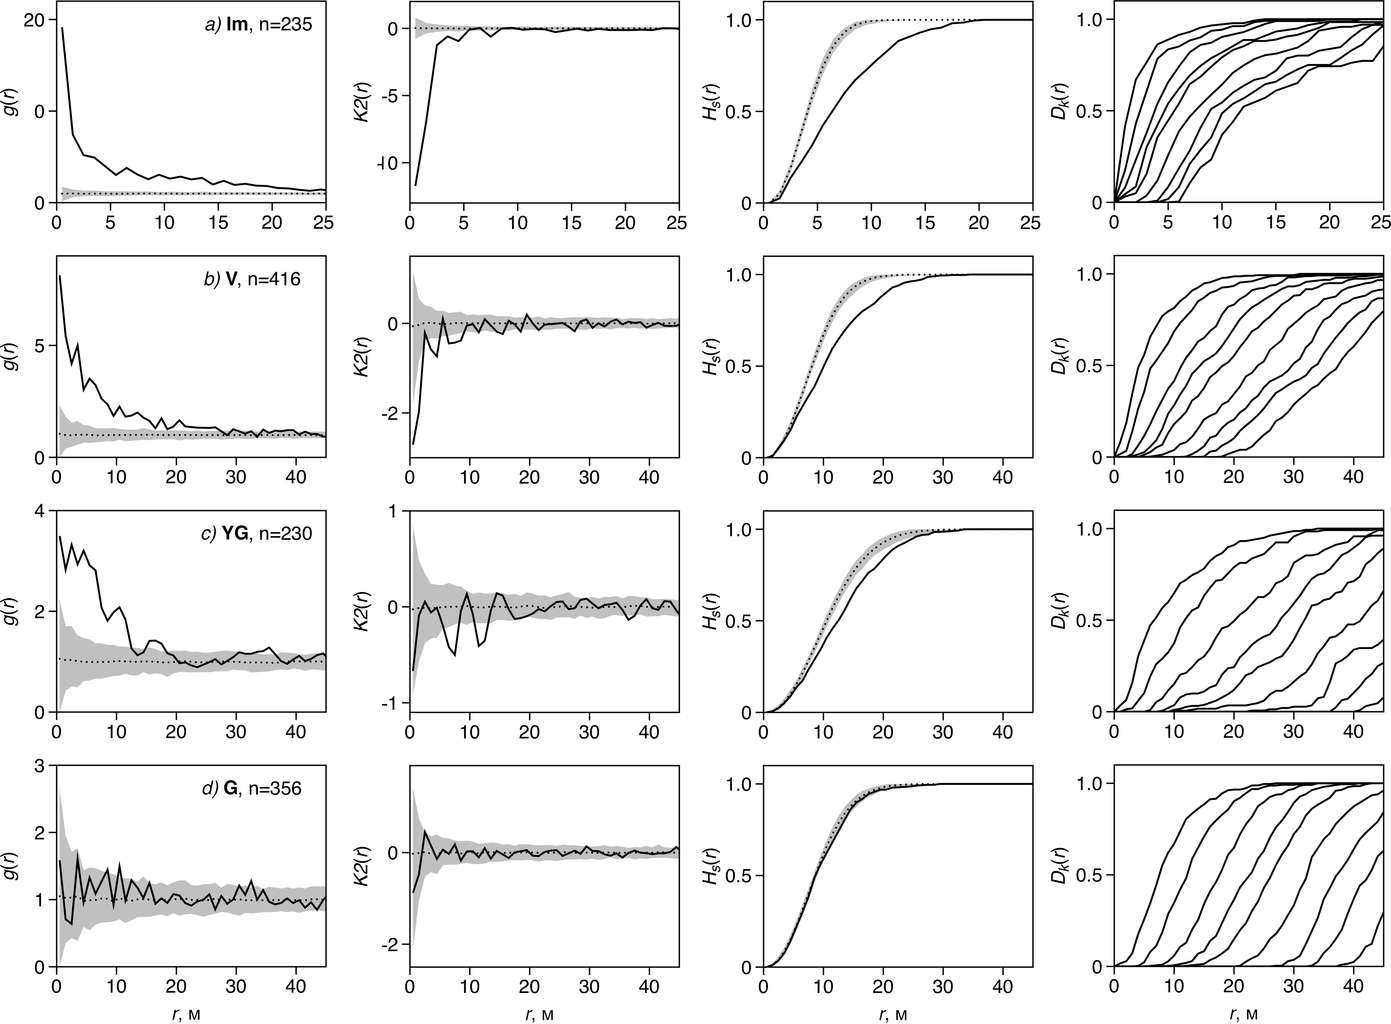
- Fig. 2. Characteristics of the structure of Tilia amurensis species using four statistical functions: a – im1 + im2 + im3; b – v1 + v2; in – v3 + g1; g – g2 + g3; n is the number of plants in the mosaic. The solid line is an empirical curve, the dashed line is the expected value in accordance with the zero-model, and the grey field is the imitation limits (zero-model CSR)
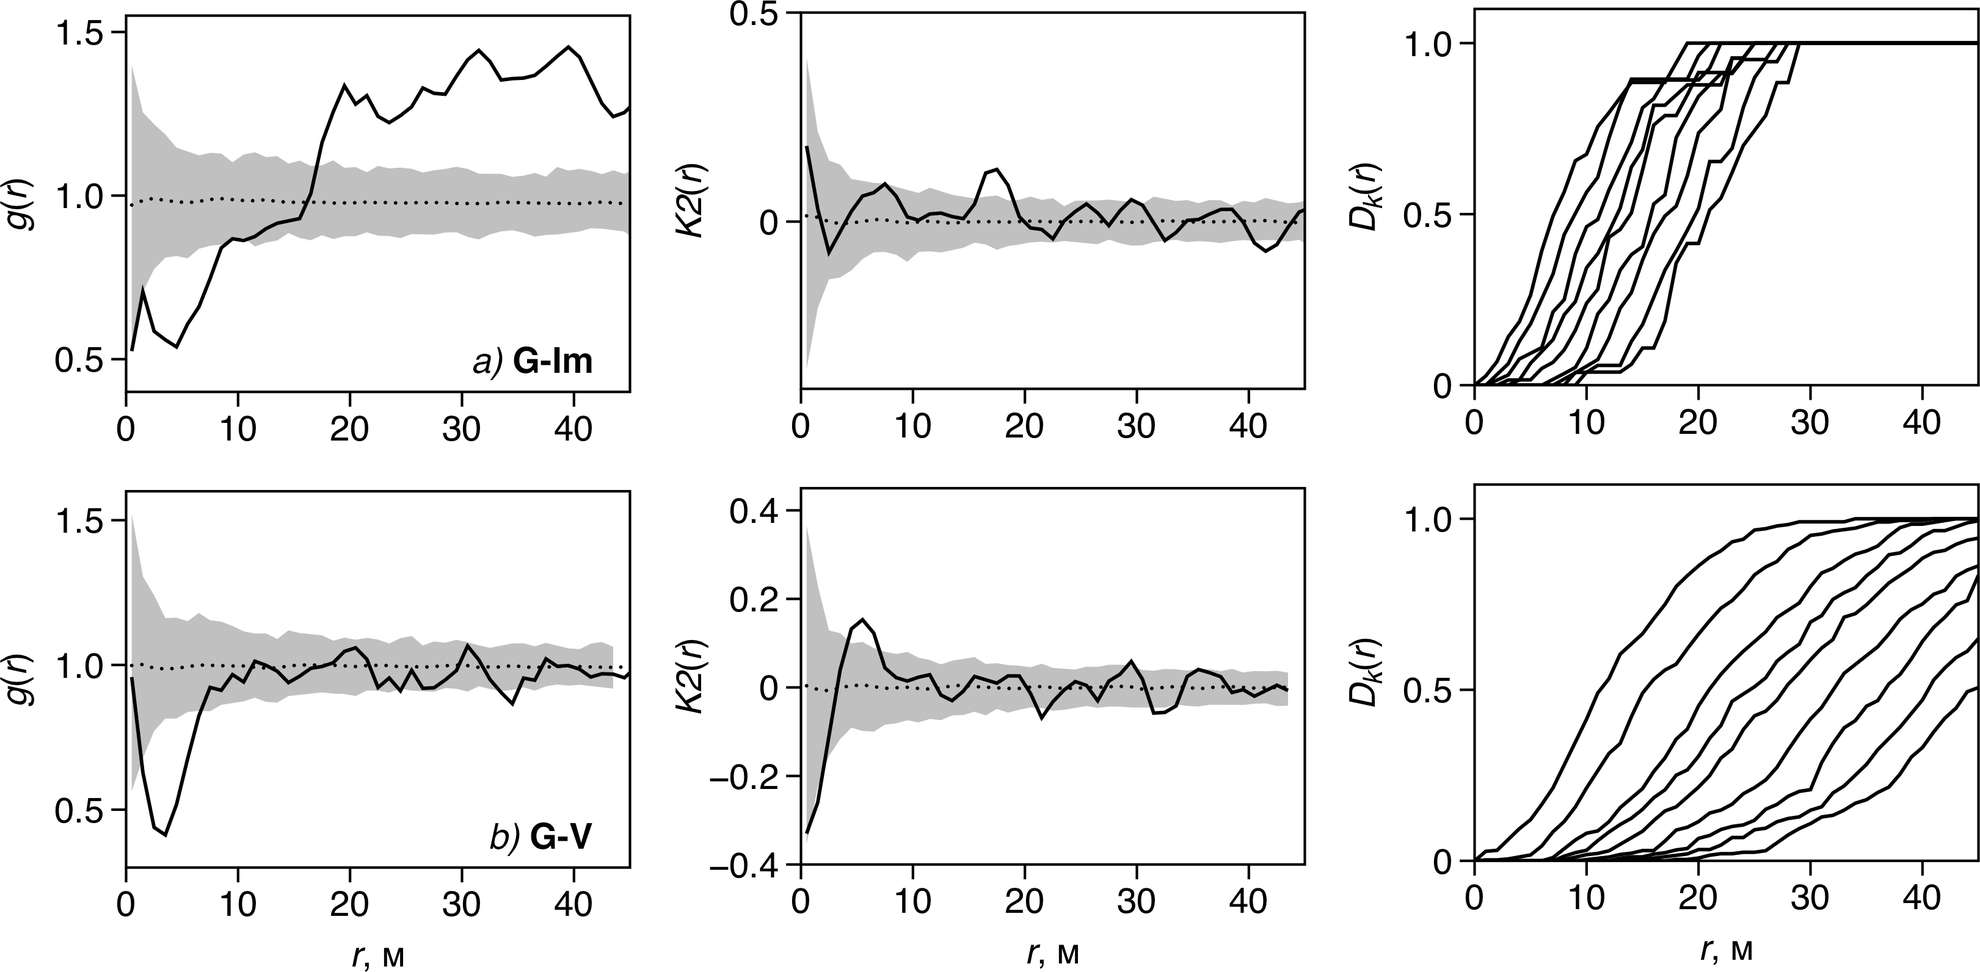
- Fig. 3. Connection between mosaics of medium- and old-growth generative species Tilia amurensis and mosaics of immature (a) and virginal (b) species. The solid line is an empirical curve, the dashed line is the expected value in accordance with the zero-model, and the grey field is the imitation limits (zero-model “antecedent conditions”)
Copyright © 2016 RJEE. THE ONLINE EDITION IS REGISTERED IN THE FEDERAL SERVICE FOR SUPERVISION OF COMMUNICATIONS, INFORMATION TECHNOLOGY, AND MASS MEDIA. REGISTRATION CERTIFICATE № FS 77 – 62950 from 04.09.2015.