


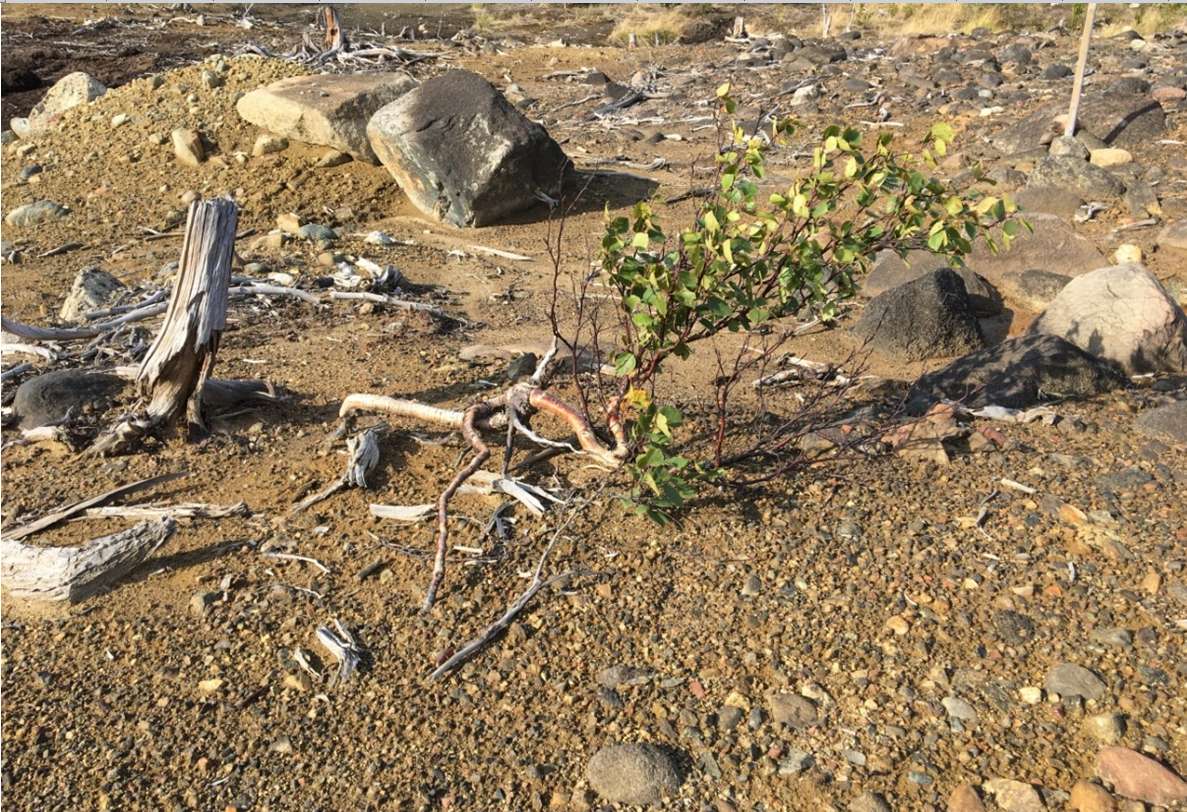
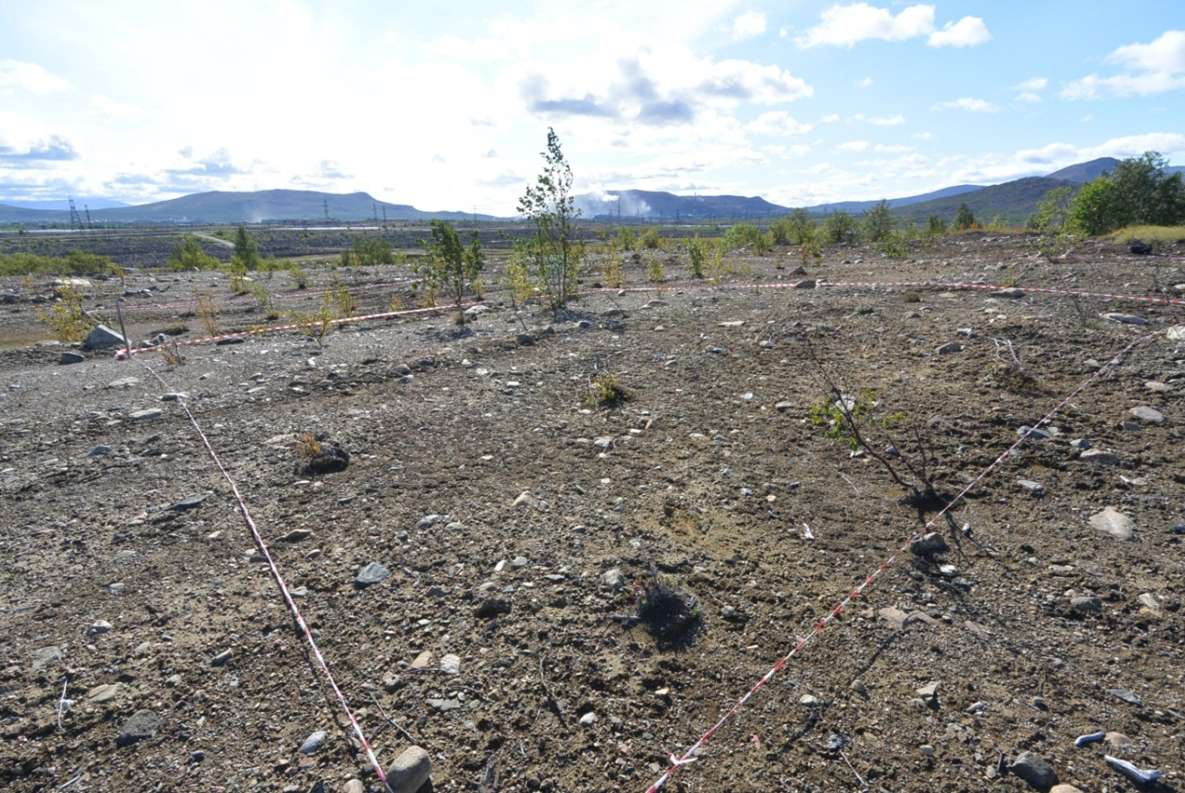
- Photo 1. Stunted birch tree on barren land (sample plot МП2003/6)
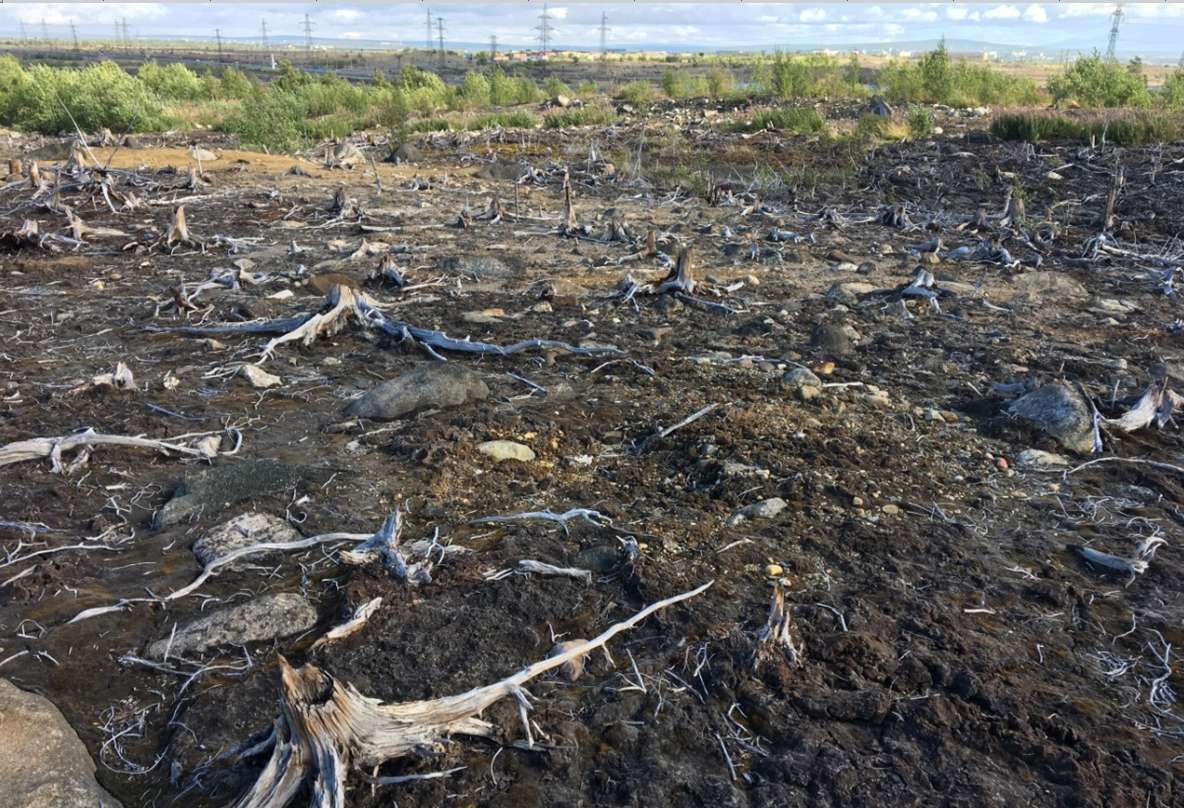
- Photo 2. Area of barren land without vegetation (sample plot МП2004/5)
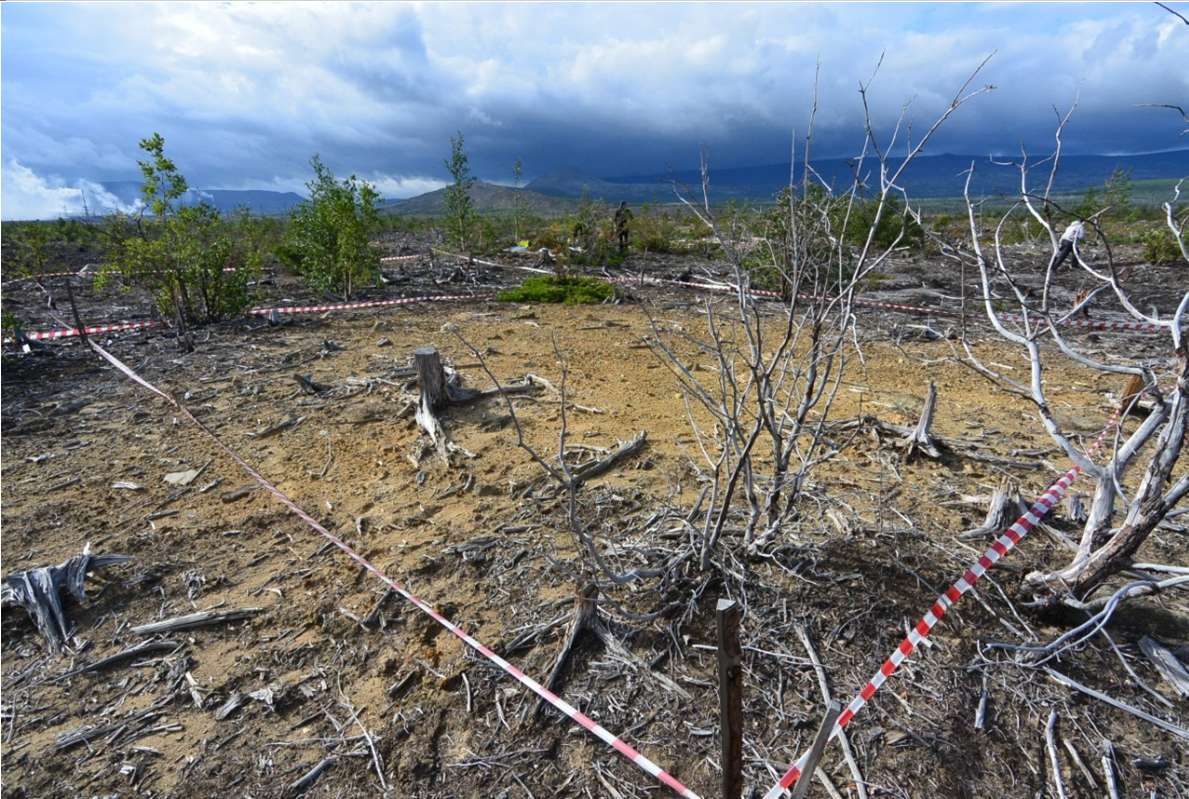
- Photo 3. Area of barren land with snags (sample plot МП2007/8)
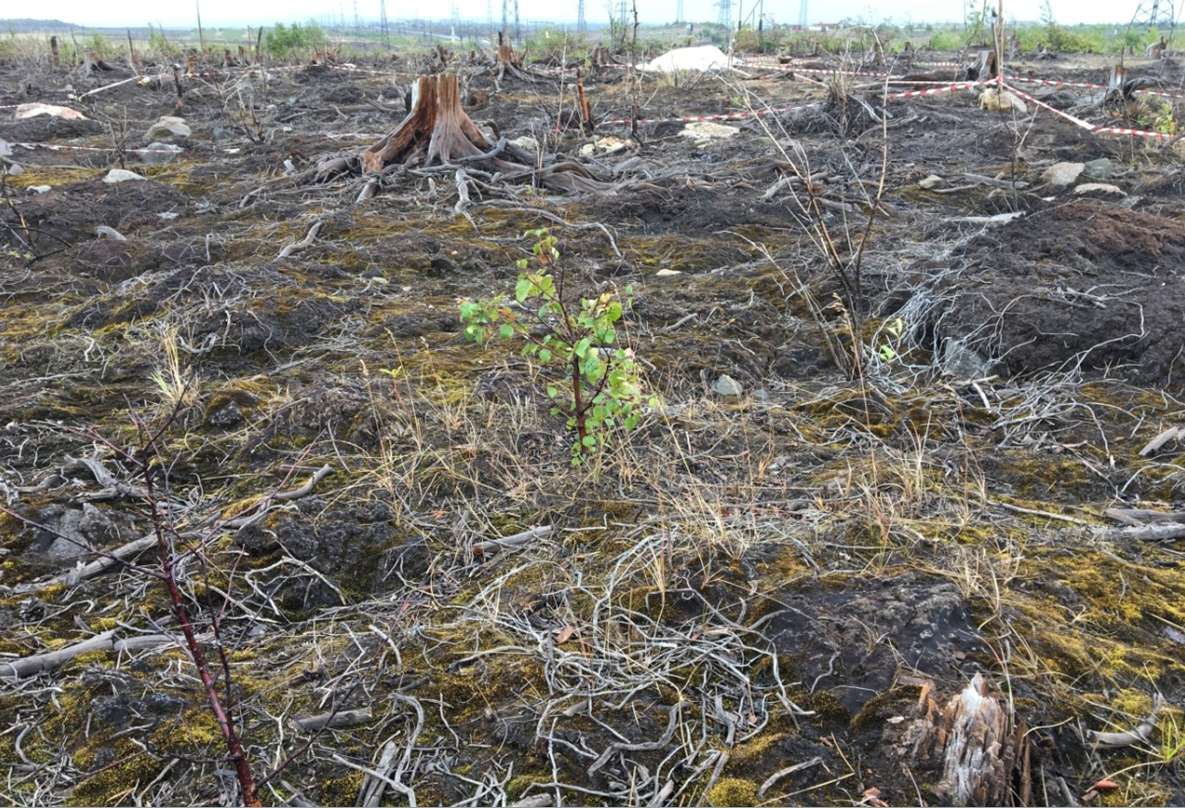
- Photo 4. Area of chemophytostabilisation with low crop preservation, badly preserved grass cover (sample plot МР2004). Thinned moss cover is Pohlia nutans
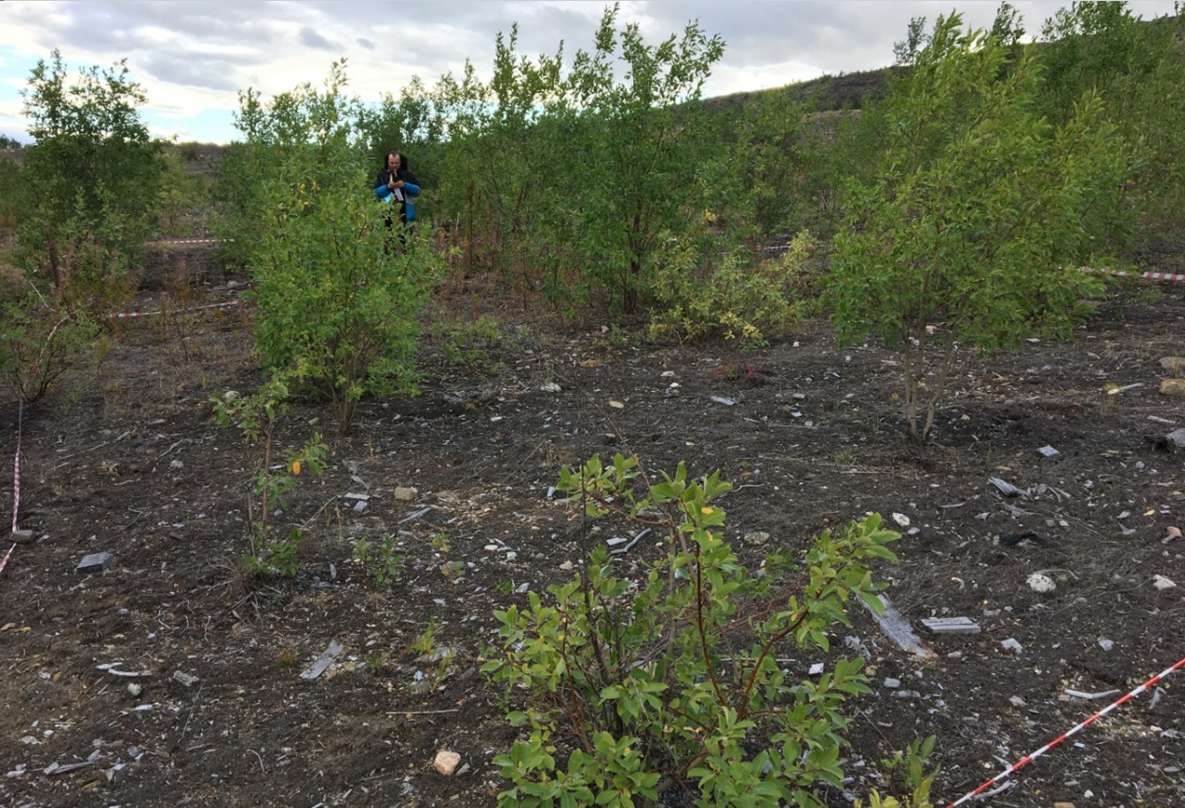
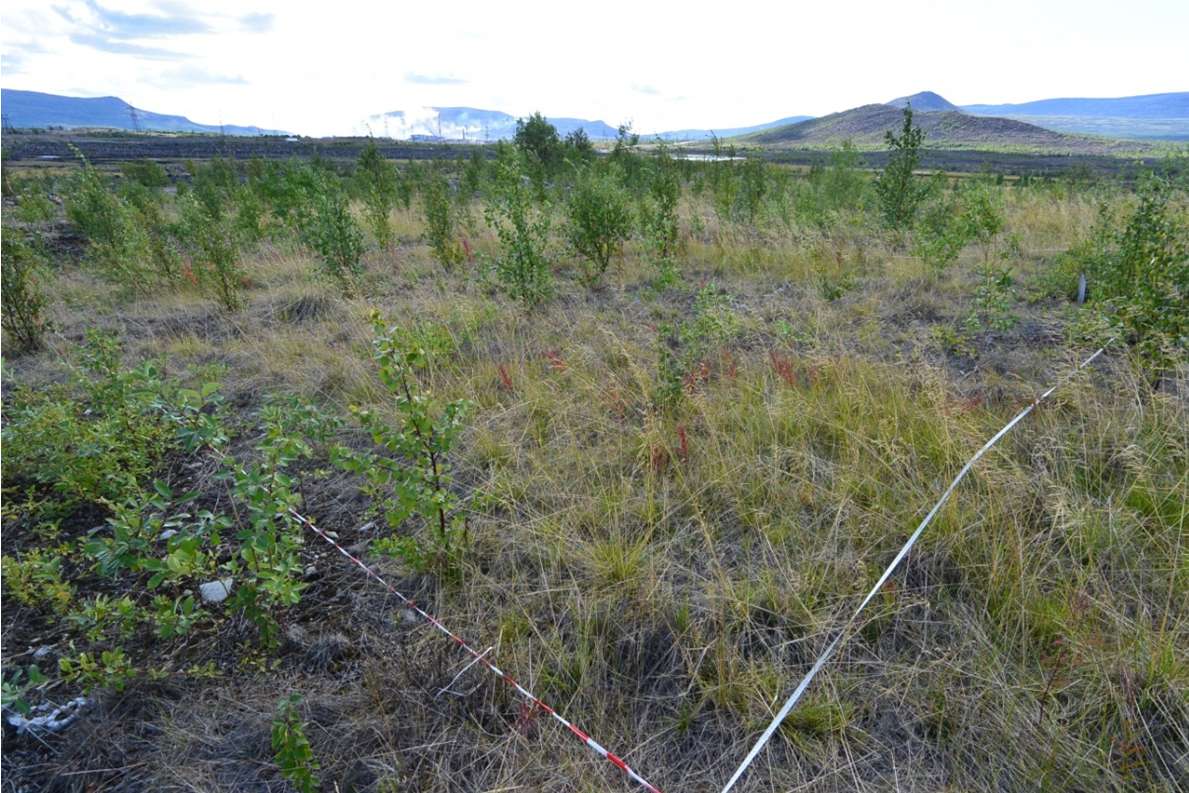
- Photo 5. Area of chemophytostabilisation with low crop preservation (sample plot МР2007)
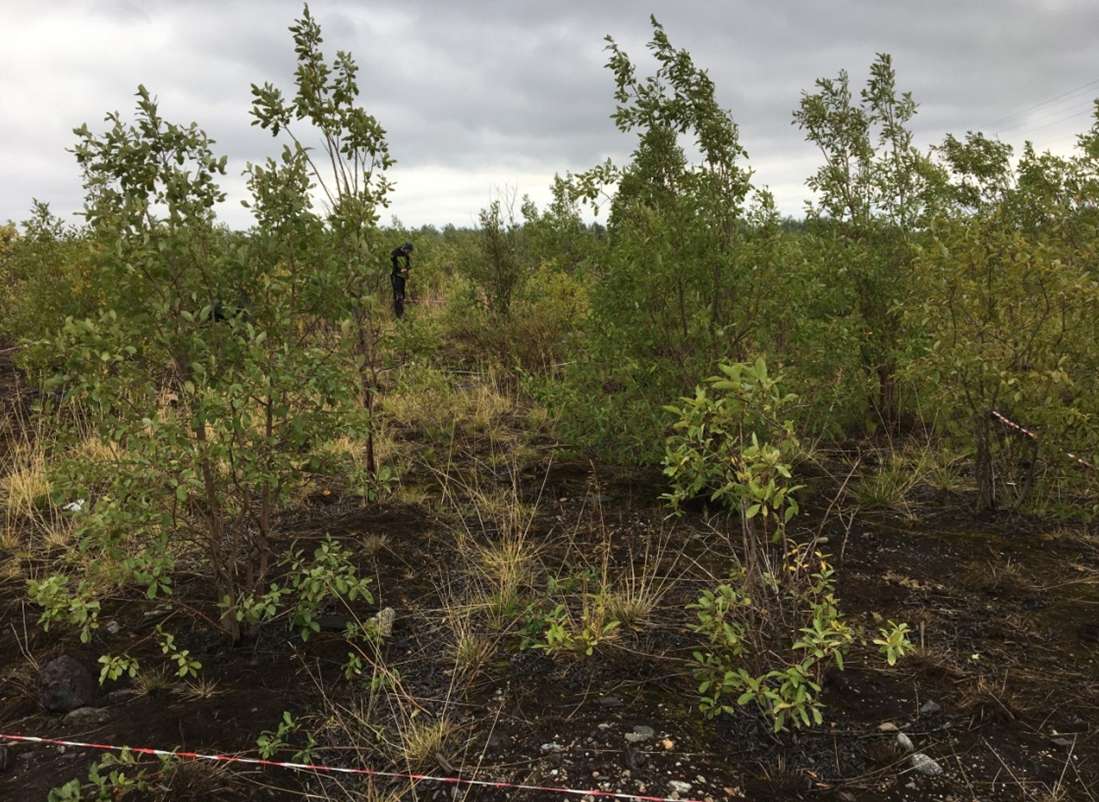
- Photo 6. Area of chemophytostabilisation (sample plot МР2007) with Alnus incana of normal vigour in a young generative state
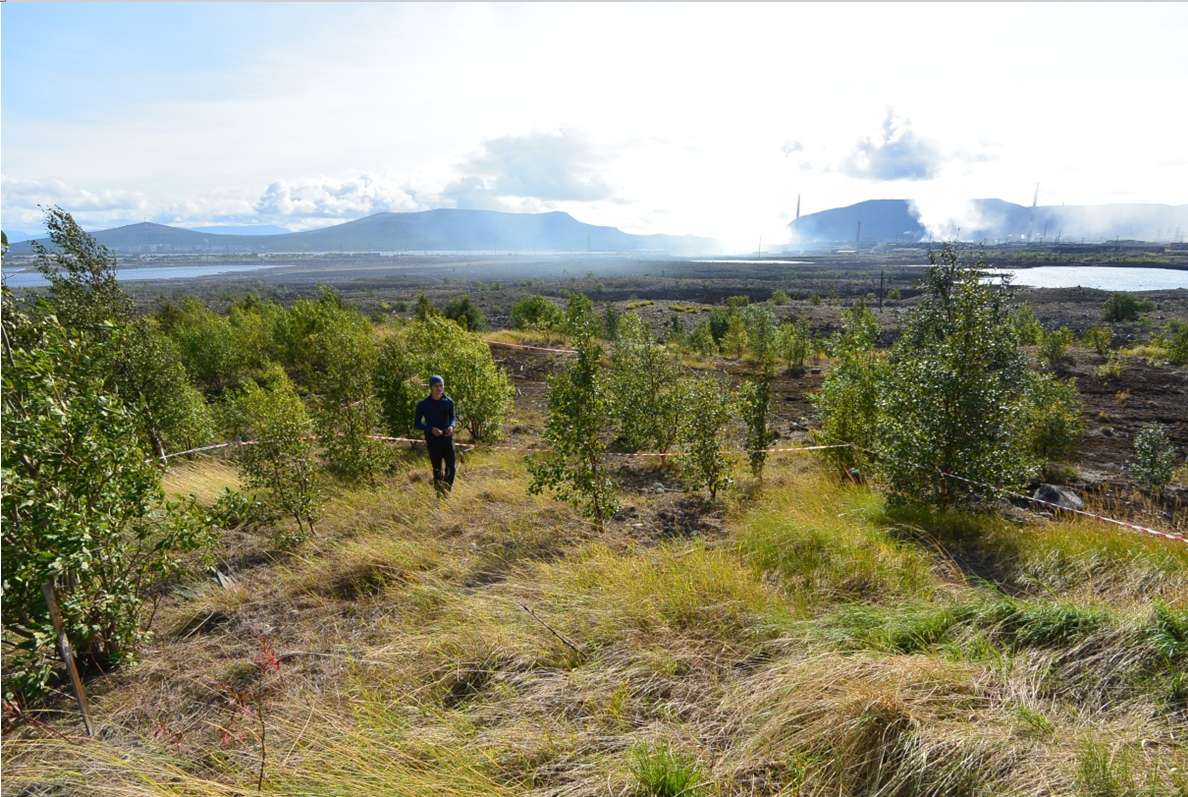
- Photo 7. Remediation area with deposited fertile layer (sample plot МРН2003). Thinned forest stand is formed by multistem trees Salix caprea; Elytrigia repens, Equisetum arvense, Chamerion angustifolium, Deschampsia caespitosa prevail in the grass cover
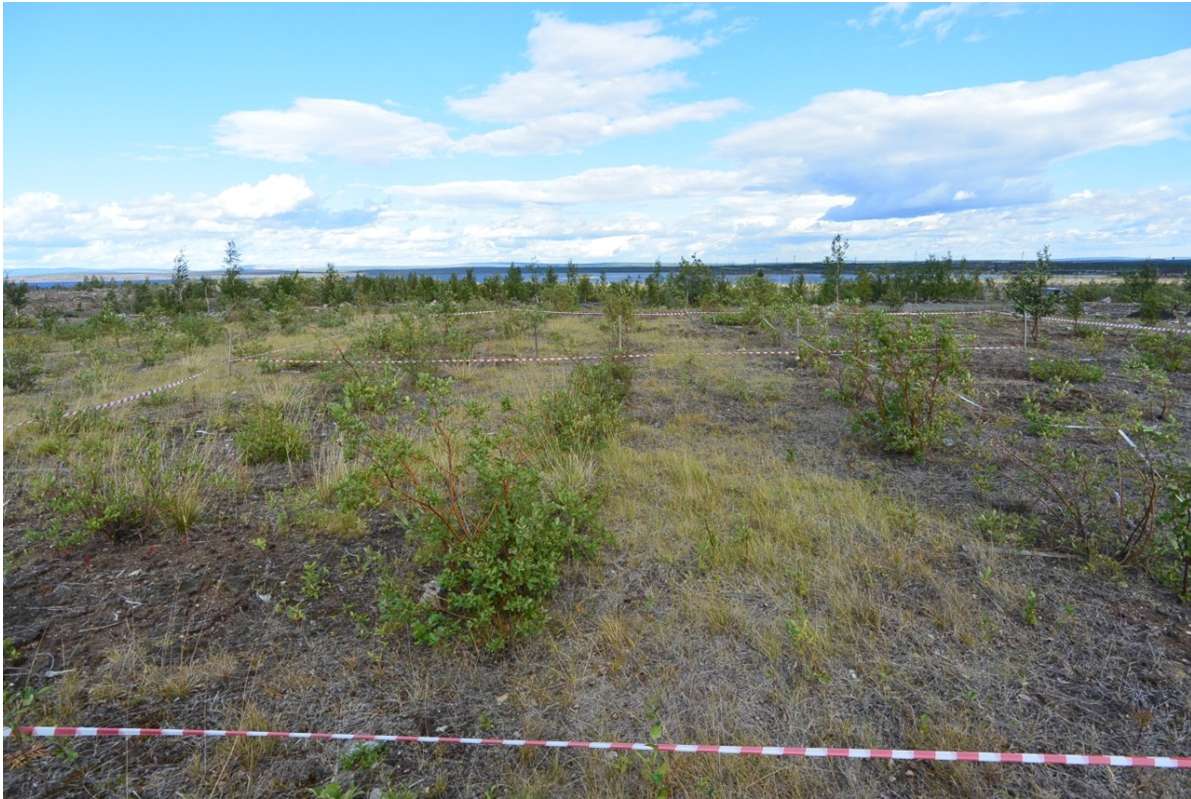
- Photo 8. Remediation area with deposited fertile layer (sample plot МРН2004). Salix caprea prevail in story B; Deschampsia caespitosa and Equisetum arvense – in thinned grass cover
- Photo 9. Remediation area with deposited fertile layer (sample plot МРН2005). Salix caprea prevail in story B; grass cover is badly preserved
- Photo 10. Remediation area with deposited fertile layer (sample plot МРН2006) in close vicinity to pollution source. Understory of Salix caprea and Betula pubescens is badly preserved, grain varieties (Calamagrostis lapponica, C. phragmitoides, Deschampsia caespitosa) prevail in grass cover
- Photo 11. Remediation area with deposited fertile layer (sample plot МРН2007). Story B is composed of Salix caprea and Betula pubescens; Deschampsia caespitosa prevails in grass cover
- Photo 12. Remediation area with deposited fertile layer (sample plot МРН2008). Story B is composed of bushes Salix caprea, Betula pubescens and Salix phylicifolia; Festuca rubra and Deschampsia caespitosa prevail in grass cover
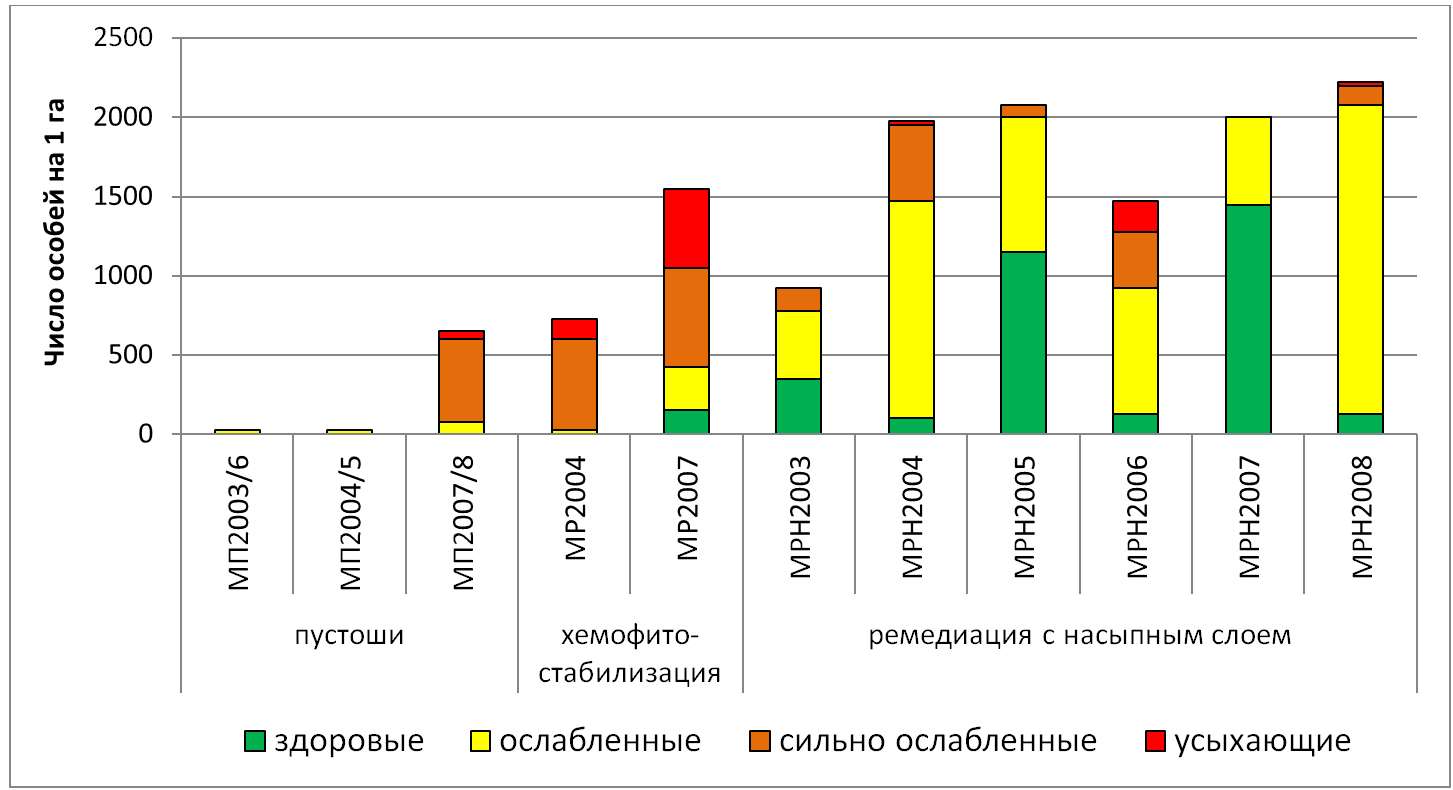
- Fig. 1. The vital status and the number of undergrowth of trees in the remediation sites amended with organic matter–rich fertile cover materials (MRN), chemophytostabilisation sites (MR) and technogenic barren sites (MP)
- Fig. 2. The average number of plant species per 100 m2 at the monitoring sites of technogenic barrens, chemophytostabilisation and remediation with organic matter–rich fertile cover materials applied
- Fig. 3. Average projective coverage of tiers at monitoring sites of technogenic barrens, chemophytostabilisation and remediation with organic matter–rich fertile cover materials applied
- Fig. 4. An ordination diagram of the vegetation properties (projective cover of trees and shrubs in tiers B and C (U), dwarf shrubs (Dsh), grasses (Gr), mosses (M), and aboveground phytomass of the ground layer (Ph); solid arrows). Variables external to the PC analysis (the number of healthy (nh), impaired (ns), severely impaired (nss), half-dead (np), dead (nd) and all trees (n), as well as the distance from the industrial complex (D) and thickness of the upper soil horizon (h)) are shown by dotted arrows
- Fig. 5. An ordination diagram of weights relative to the vegetation properties for the monitoring sites: 1 – МП2003/6 и МП2004/5, 2 – МП2007/8 и МБ1, 3 – МР2004 и МР2007, 4 – МРН2007 и МРН2008, 5 – МРН2004 и МРН2005, 6 – МРН2006, 7 – МРН2003. Designation of sample plots is presented in the Table 1
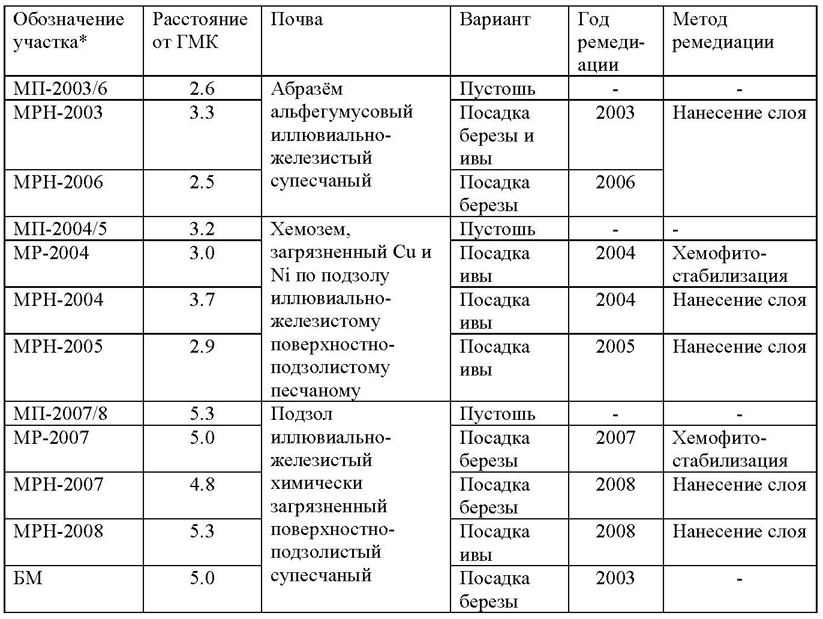
- Table 1. Remediation sites and barren lands in the vicinity of Monchegorsk
- Table 2. Characteristic of undergrowth on technogenic barrens in the vicinity of Monchegorsk
Copyright © 2016 RJEE. THE ONLINE EDITION IS REGISTERED IN THE FEDERAL SERVICE FOR SUPERVISION OF COMMUNICATIONS, INFORMATION TECHNOLOGY, AND MASS MEDIA. REGISTRATION CERTIFICATE № FS 77 – 62950 from 04.09.2015.