


- Fig.1 Distribution of gaps in a forest stand canopy according to the size: a – proportion of gaps of different radius; b – cumulative proportion of gaps of different radius
- Fig. 2 Distribution of Pinus koraiensis individuals on permanent samples: a – juvenile individuals; b – immature individuals (im1, im2, im3); c – virginile individuals (v1, v2); d – young generative individuals (v3, g1); e – middle- and old-aged generative individuals (g2, g3)
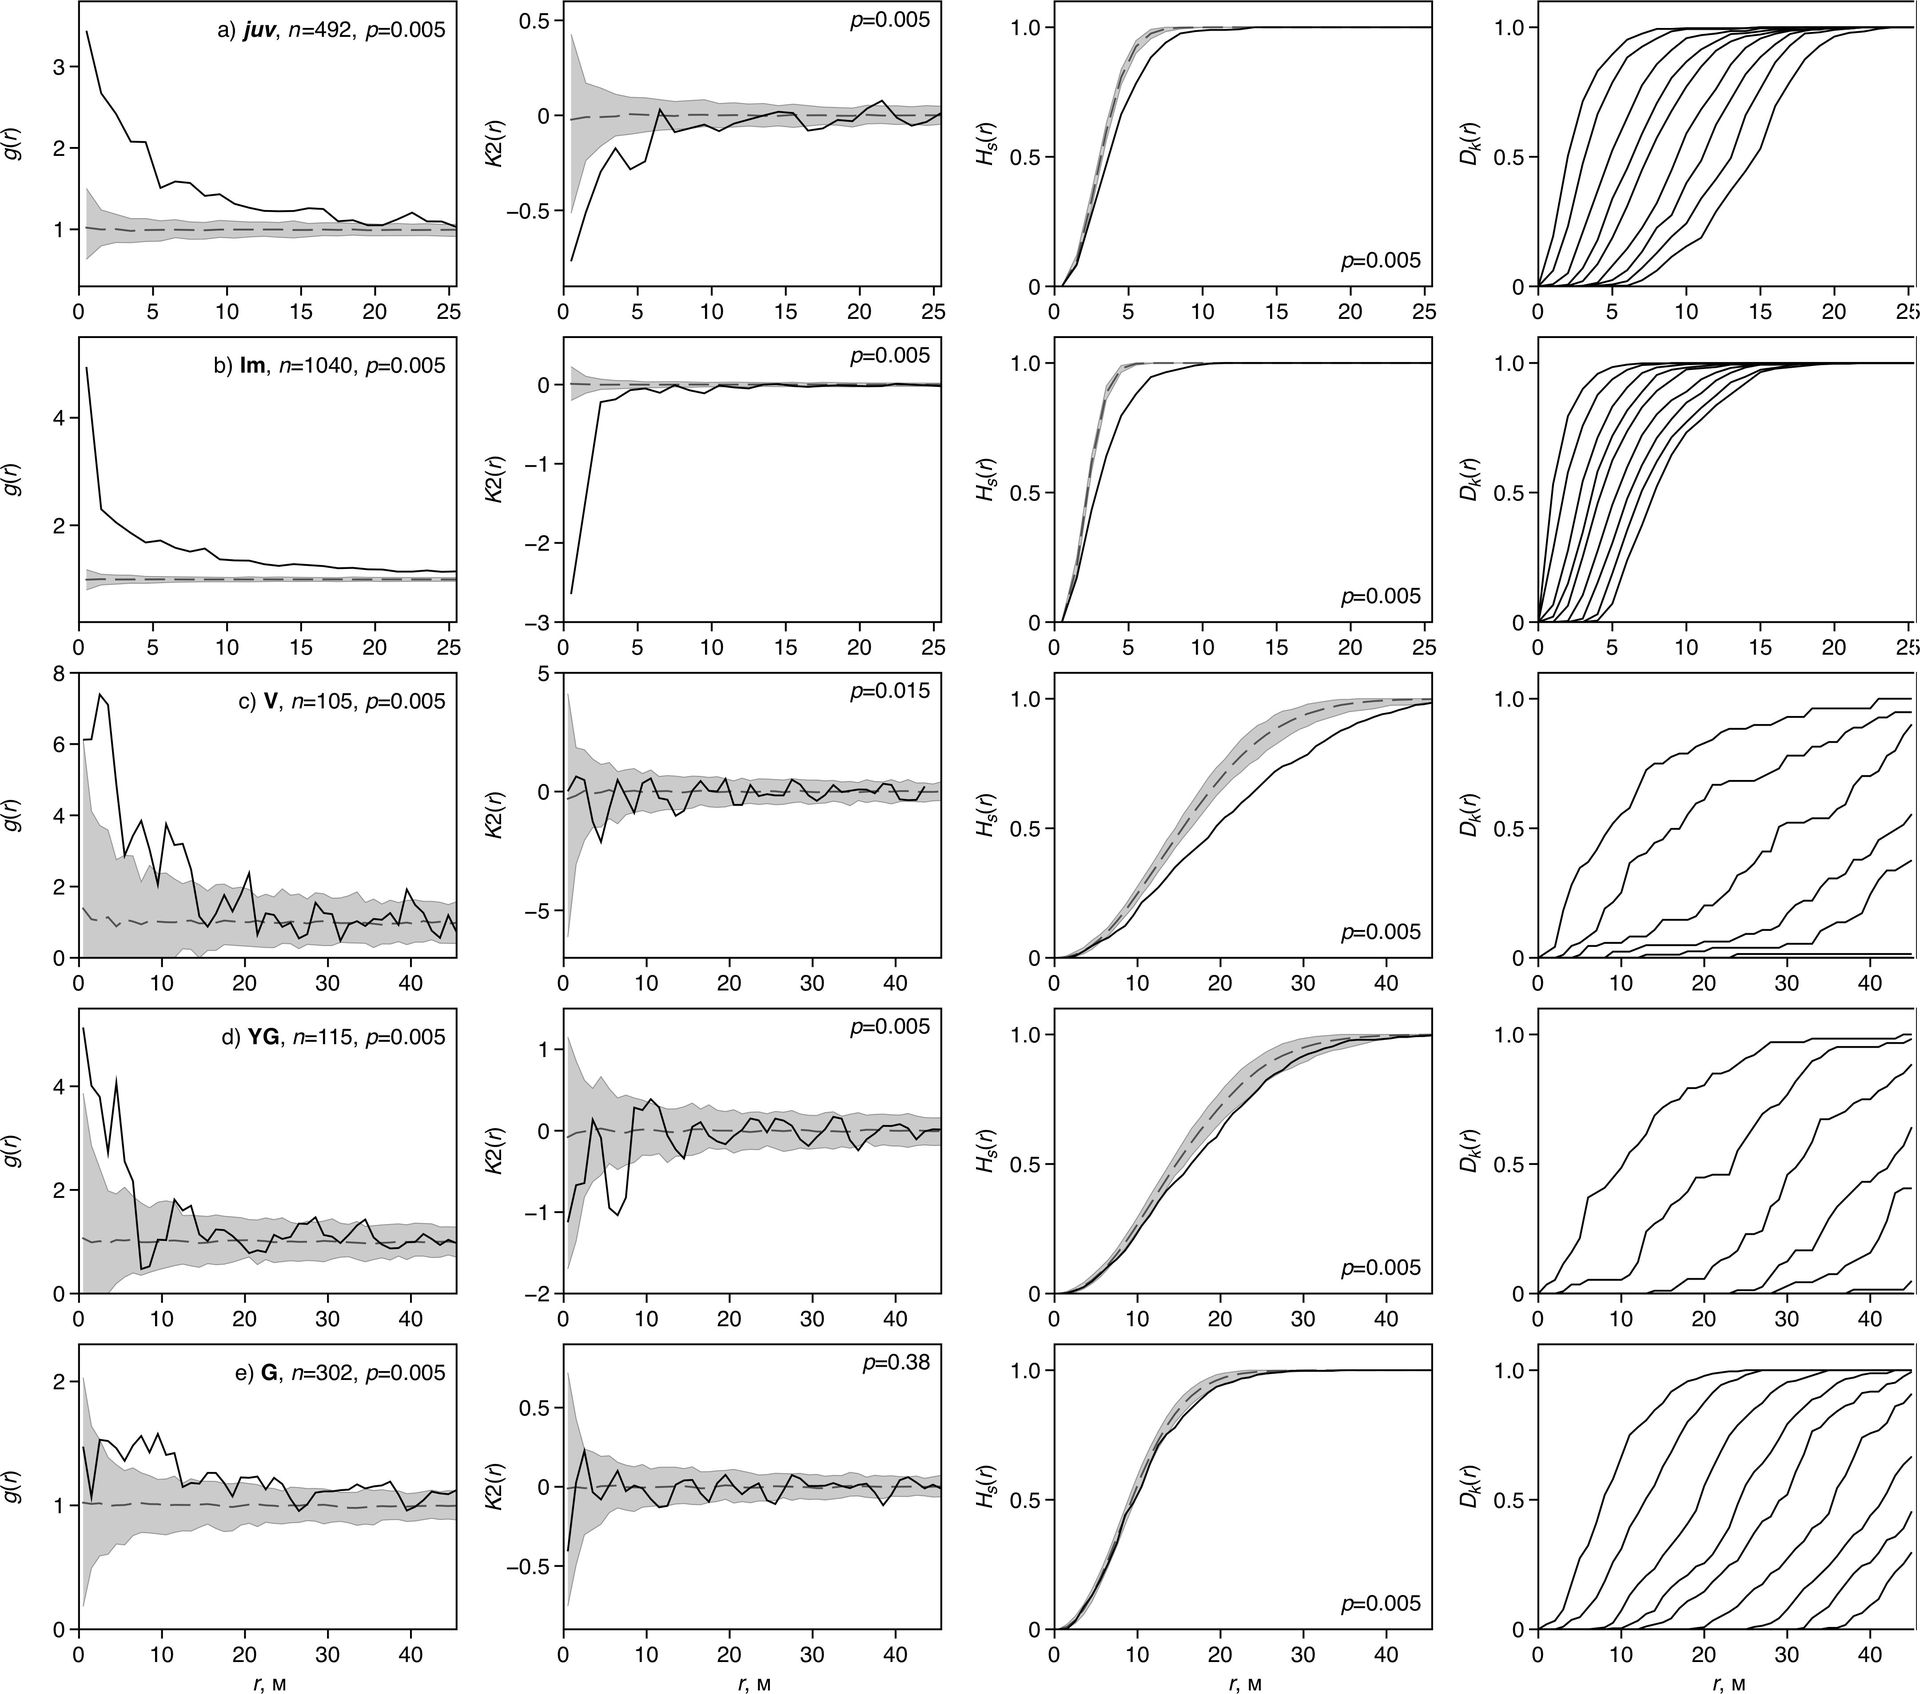
- Fig. 3 Characteristics of mosaic structure of Pinus koraiensis individuals with the use of four summary statisics: a – juv; b – im1+im2+im3; c – v1+v2; d – v3+g1; e – g2+g3; n – number of individuals in a mosaic, p – p-level according to the results of GoF-test. Full line – empirical curve, dotted line – expected value according to the null model, grey field – simulated envelopes (null model CSR)
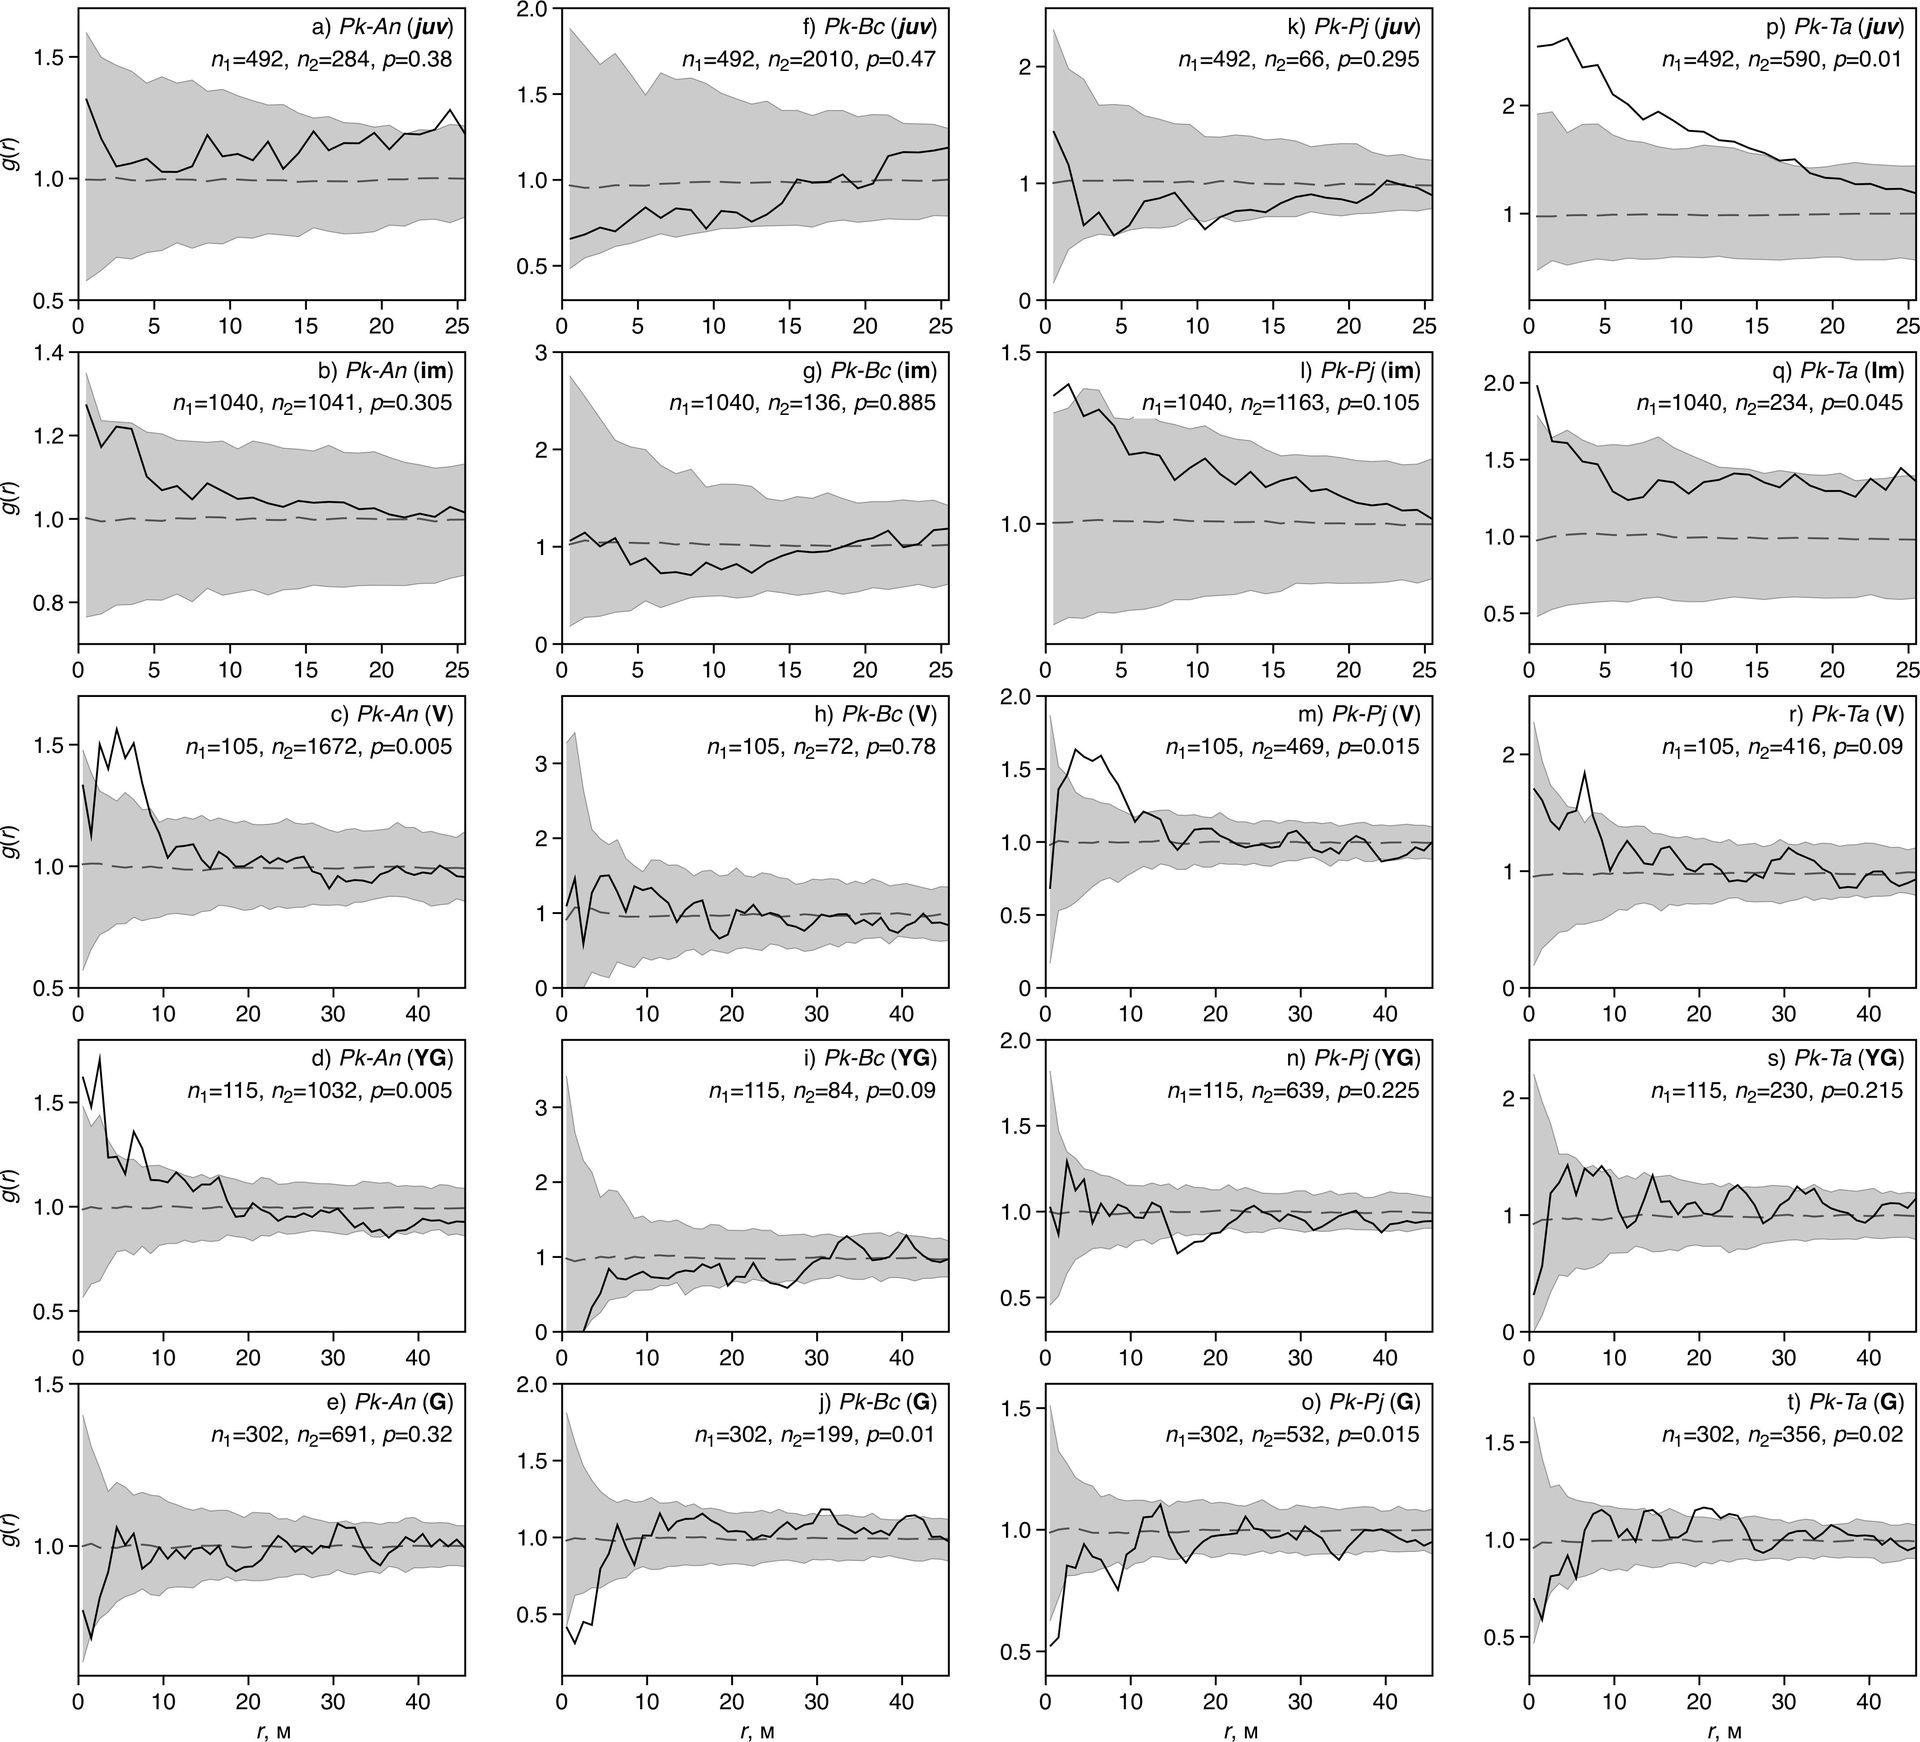
- Fig. 4 Results of paired analysis of correlation between mosaic structure of Pinus koraiensis (Pk) individuals with mosaic structure of Abies nephrolepis (An), Betula costata (Bc), Picea ajanensis (Pa) и Tilia amurensis (Ta) individuals: a – juv; b – im1+im2+im3; c – v1+v2; d – v3+g1; e – g2+g3; n1, n2 – number of individuals in the mosaics of species pair, p – p-level on the results of GoF-test. Full line – empirical curve, dotted line – expected value according to the null model, grey field – simulated envelopes (null model «independence»)
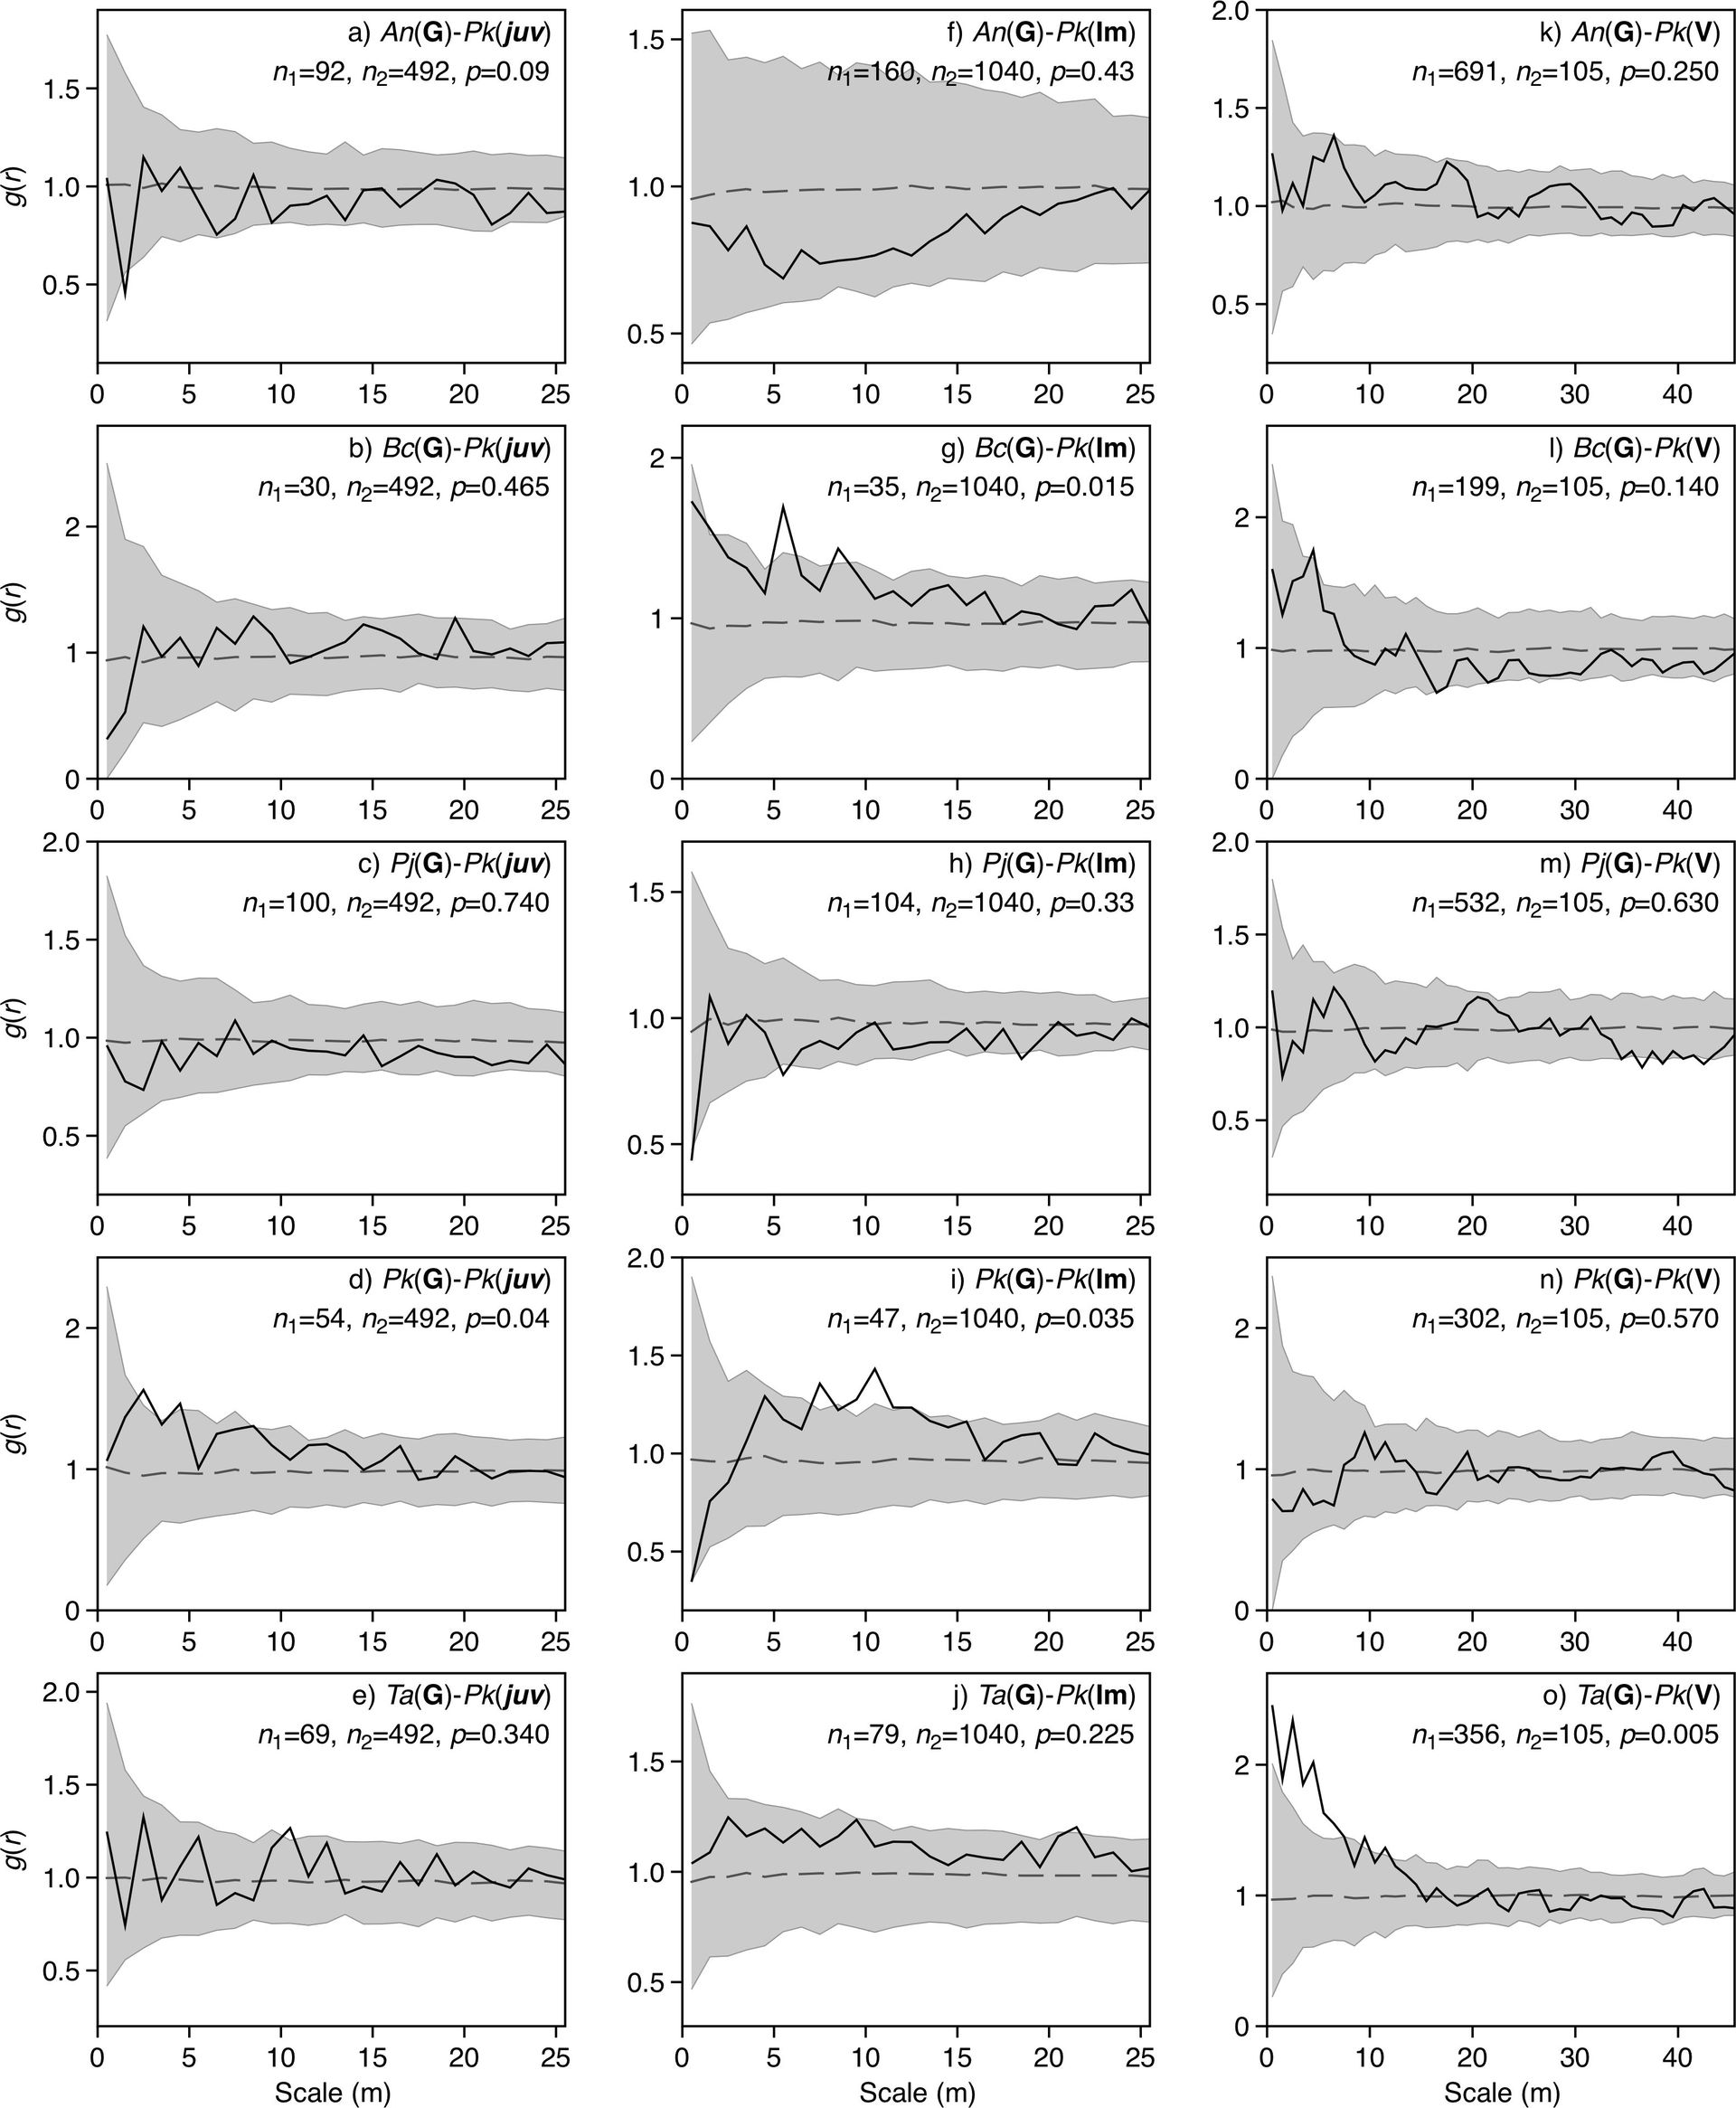
- Fig. 5 The analysis results of correlation between the mosaic structure of juvenile, immature and virginile Pinus koraiensis (Pk) individuals with the mosaic structure of generative individuals: a – Abies nephrolepis (An); b – Betula costata (Bc); c – Picea ajanensis (Pa); d – Pinus koraiensis (Pk); e – Tilia amurensis (Ta); juv – juvenile individuals, Im – im1+im2+im3, V – v1+v2, G – g2+g3; n1 и n2 – number of individuals in the first and second mosaics, p – p-level on the results of GoF-test. Full line – empirical curve, dotted line – expected value according to the null model, grey field – simulated envelopes (null model «independence»)
- Fig. 6 Observed and expected frequence of juvenile (juv) and immature (Im – im1+im2+im3) individuals on the substrate of different types: L – leaf litter, F – semidecomposed windfall and stubs, V – wind-soil complexes. The area of each rectangle is proportional to the frequency of the box of the corresponding cross tables. Full and dotted lines mean positive and negative deviation from the expected frequencies. The colour of the rectangle corresponds to the standardized remains (values are shown in the legend). Light grey and dark grey rectangles show significant deviation form the expected frequencies (with a = 0,005 and a = 0,0001 respectively)
Copyright © 2016 RJEE. THE ONLINE EDITION IS REGISTERED IN THE FEDERAL SERVICE FOR SUPERVISION OF COMMUNICATIONS, INFORMATION TECHNOLOGY, AND MASS MEDIA. REGISTRATION CERTIFICATE № FS 77 – 62950 from 04.09.2015.