


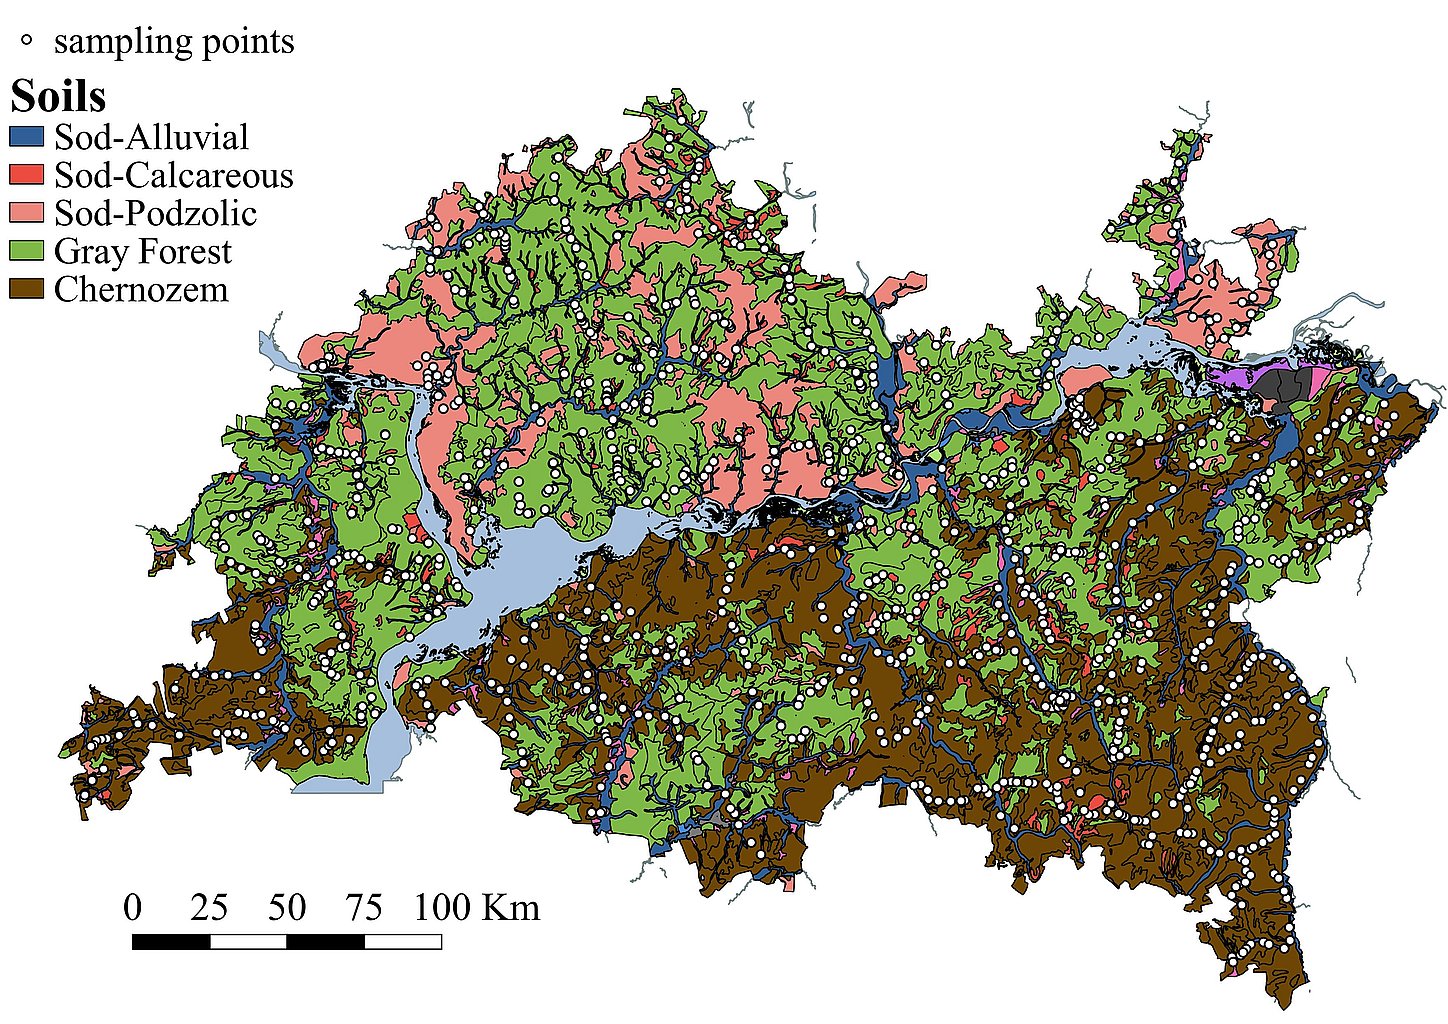
- Fig. 1. Locations of sampling points
- Fig. 2. (a-i) Spatial distribution of heavy metals content in the topsoil
- Fig. 3. Graphical display of the first three RCs of the PCA analysis a) RC1 vs. RC2; b) RC1 vs. RC3
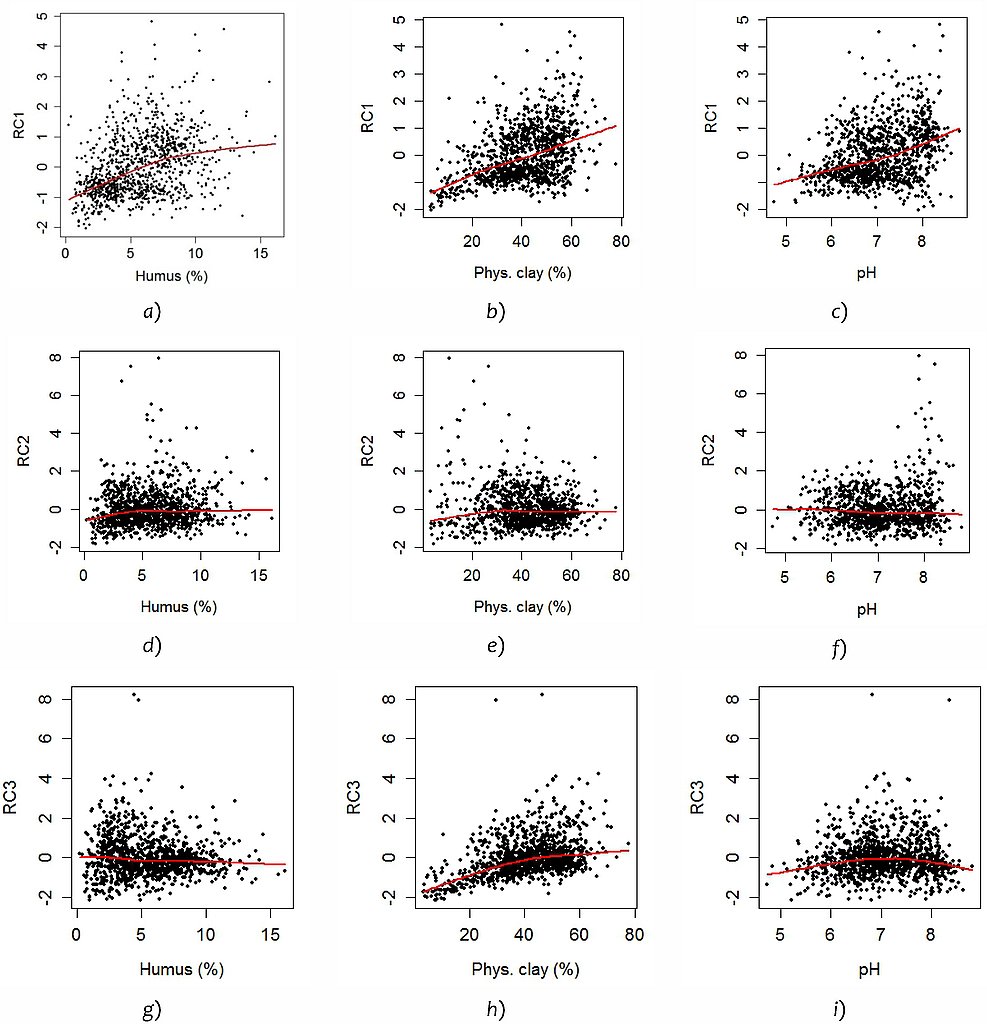
- Fig. 4. Relationships between humus content, particle size distribution and pH and scores of the first three
- Fig. 5. a) Nemerow Comprehensive Pollution Index, and b) Saet-based Comprehensive Pollution Index
Copyright © 2016 RJEE. THE ONLINE EDITION IS REGISTERED IN THE FEDERAL SERVICE FOR SUPERVISION OF COMMUNICATIONS, INFORMATION TECHNOLOGY, AND MASS MEDIA. REGISTRATION CERTIFICATE № FS 77 – 62950 from 04.09.2015.