


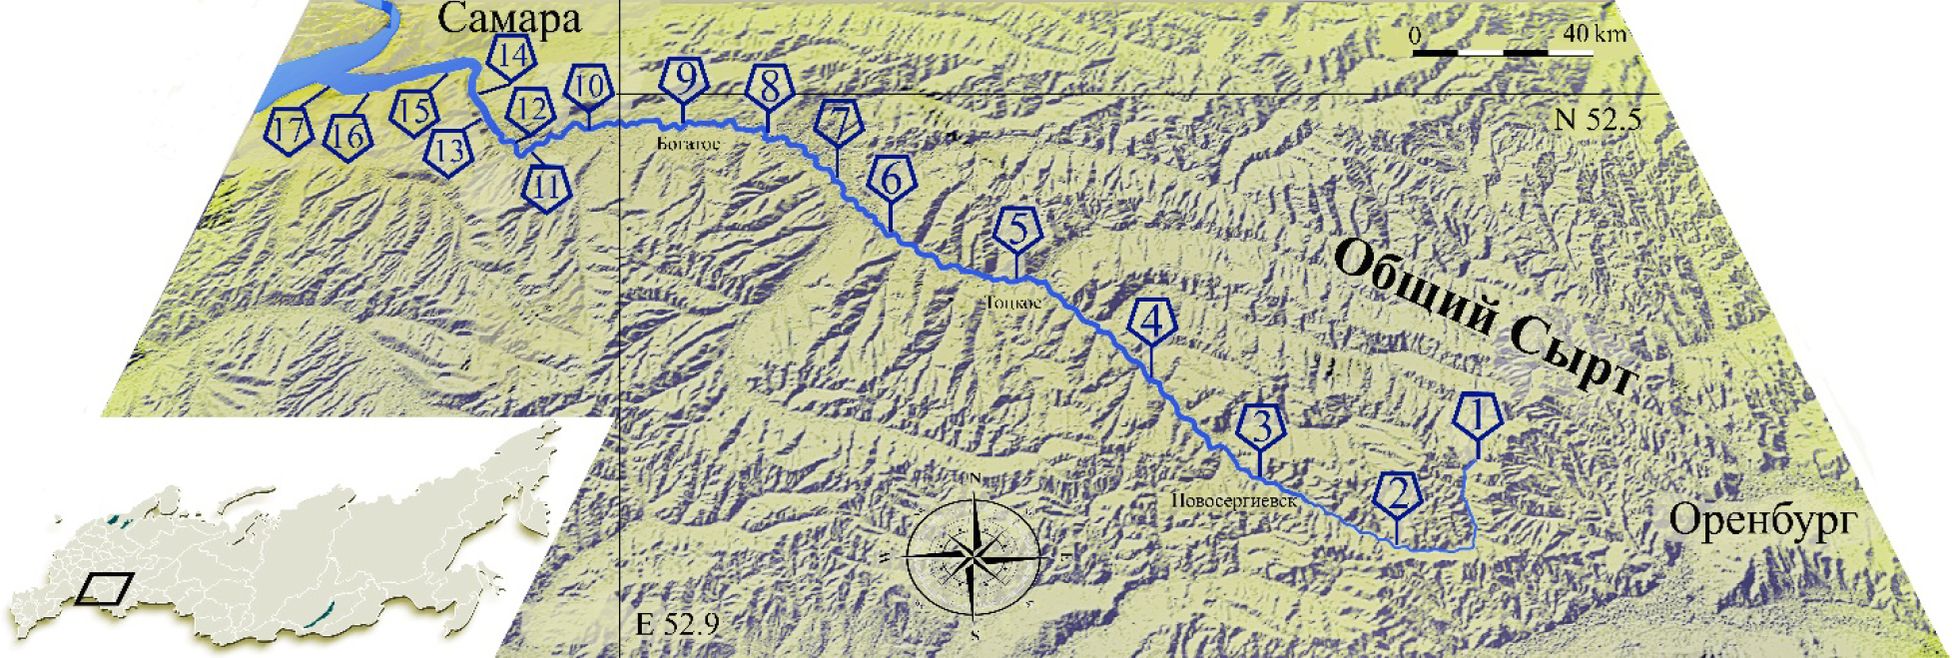
- Fig. 1. Map of the study area. The location of stations on the Samara River
- Fig. 2. Changes in the density and biomass of V. (V.) viviparus in the Samara river
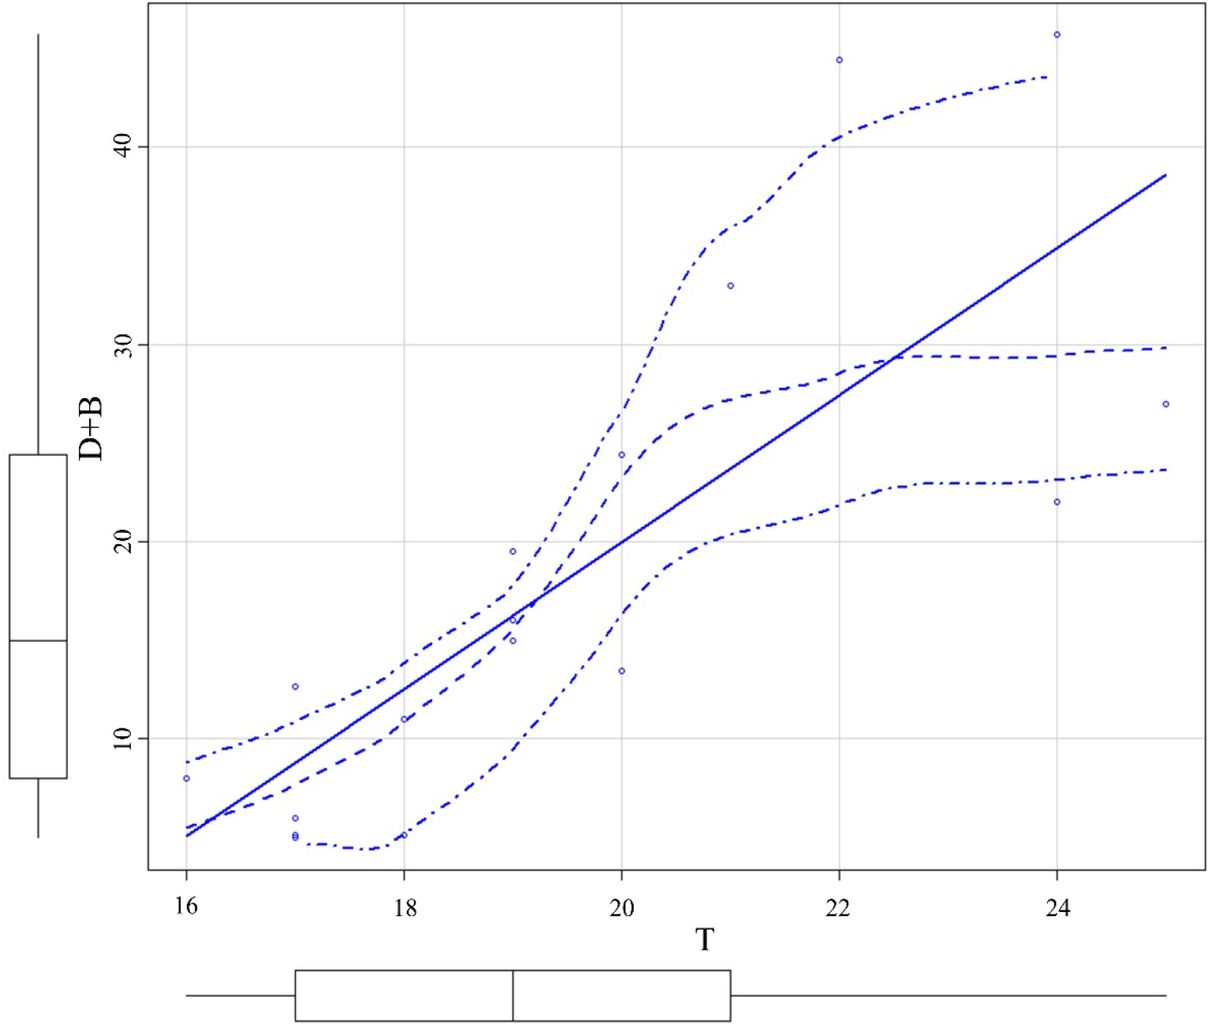
- Fig. 3. Scattering diagram for the relationship between density+biomass (D+B) of V. (V.) viviparus and temperature (T) water in the Samara river with confidence intervals
- Fig. 4. Diagram of the relationship between environmental factors and quantitative indicators of the V. (V.) viviparus mollusk in the Samara river (vectors: V – current velocity, H – depth, M – macrophyte area, TDS – mineralization, pH – hydrogen index, T – temperature, O2 – dissolved O2, G – soil type, WT – transparency, B – width)
Copyright © 2016 RJEE. THE ONLINE EDITION IS REGISTERED IN THE FEDERAL SERVICE FOR SUPERVISION OF COMMUNICATIONS, INFORMATION TECHNOLOGY, AND MASS MEDIA. REGISTRATION CERTIFICATE № FS 77 – 62950 from 04.09.2015.