


- Fig. 1. Populations of the russet ground squirrel where the genetic material for research was collected: a – the village of Chirikovo, Kuzovatovsky district, Ulyanovsk region (53.7472 ° N, 47.8277 ° E); б – Paltsinsky Island (54.3905 ° N, 48.4794 ° E)
- Fig. 2. Results of mtDNA restriction analysis (D-loop) of russet ground squirrels from: a – populations near the village of Chirikovo in 2005-2010 (Ch1); б – populations near the village of Chirikovo in 2018–2019 (Ch2). A, B2, C1, C1 * – identifiedDNAmitotypes
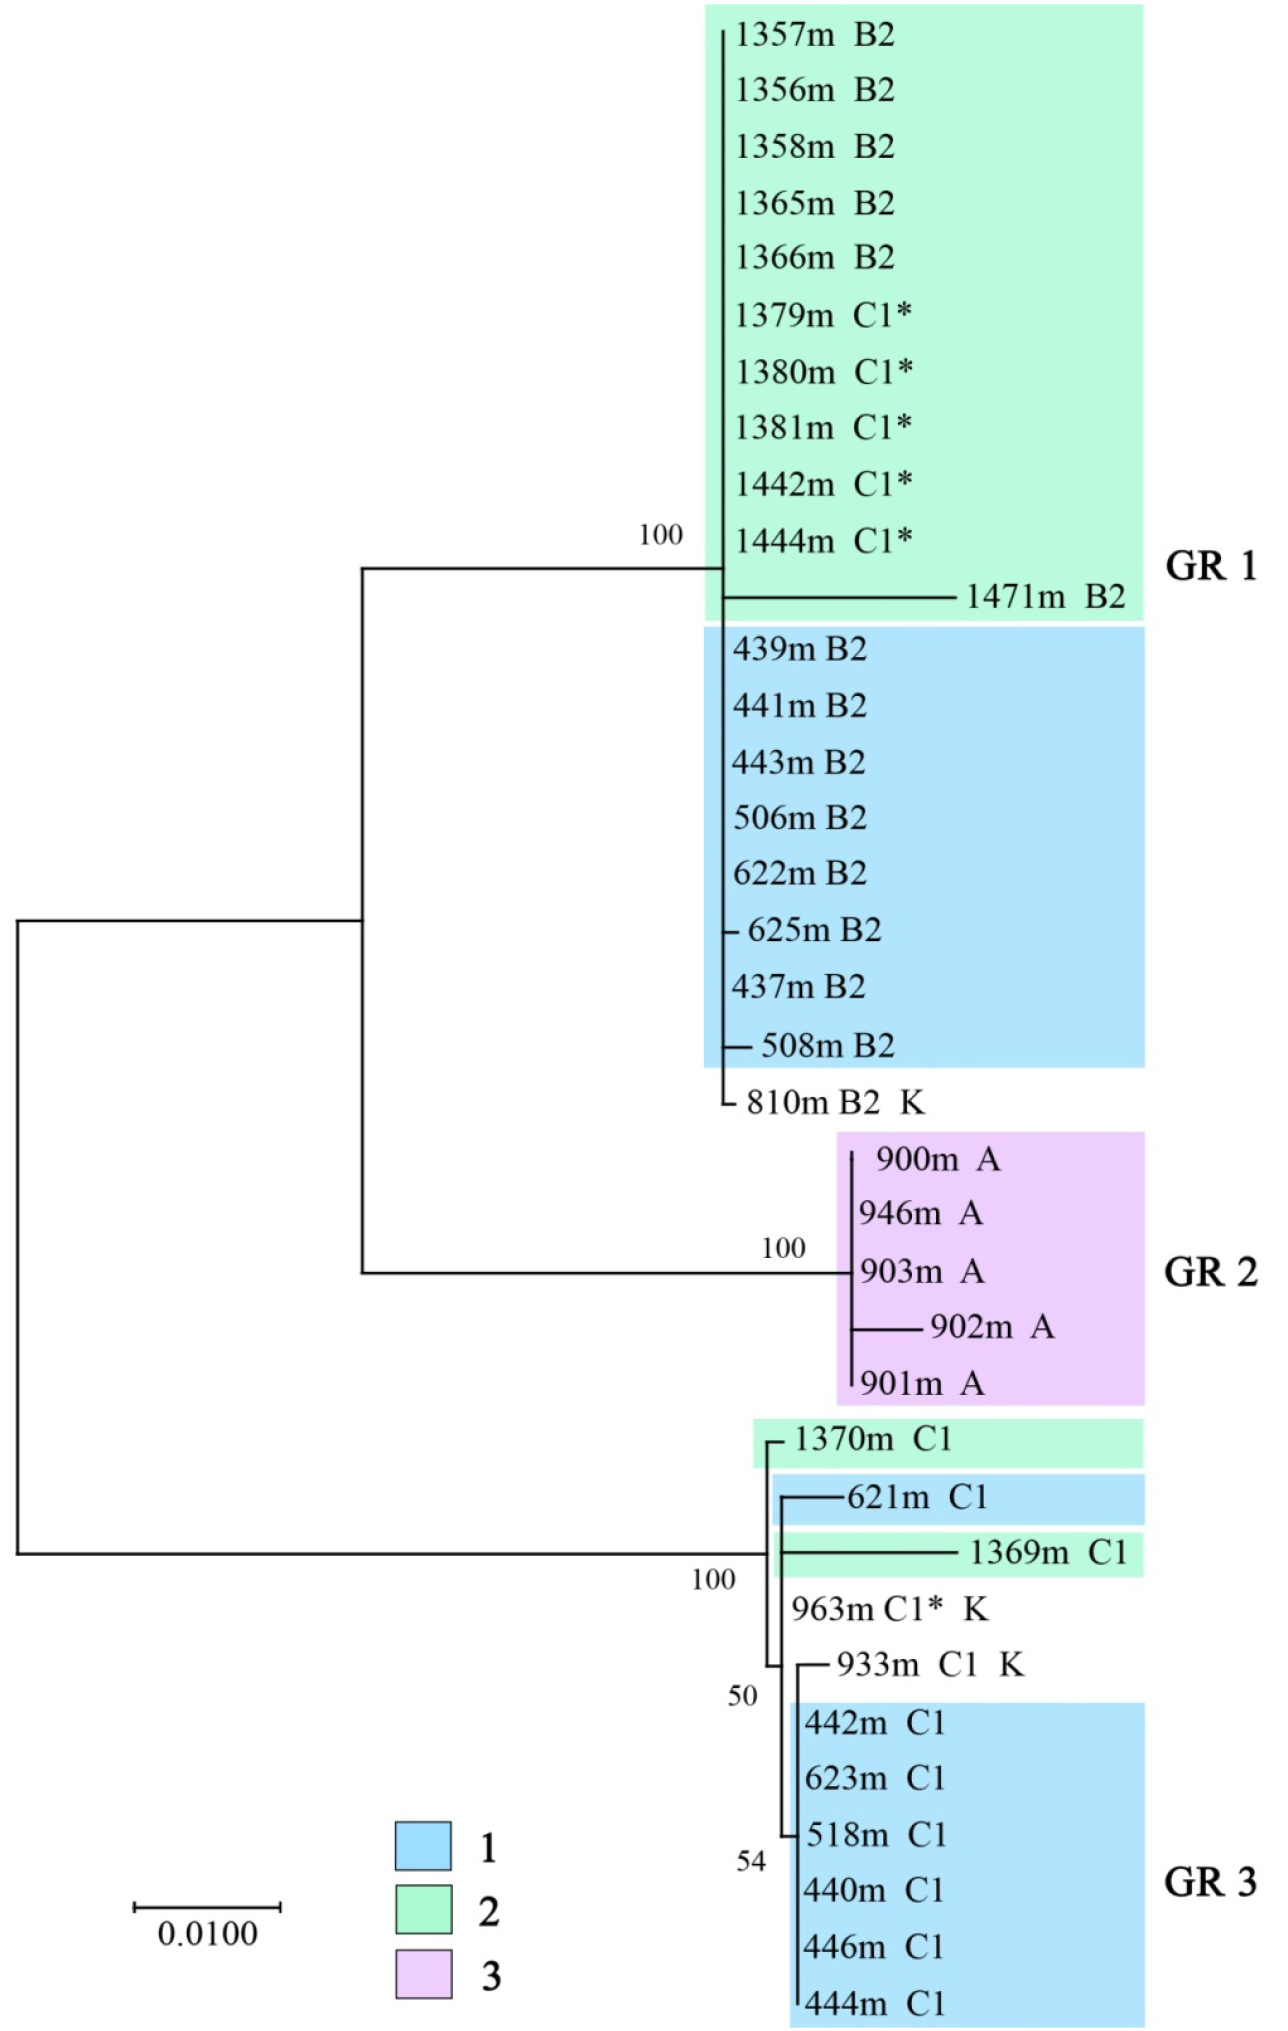
- Fig. 3. Results of genetic ML-analysis (HKY model) of nucleotide sequences (n = 32) of the mtDNA D-loop region (1051 bp), showing the phylogenetic relationships between mitotypes characterizing the model populations of the russet ground squirrel. In nodes – results of bootstrap analysis (1000 replicas), scale – genetic distances between mitotypes, K – control sequences. Populations: 1 – the village of Chirikovo in 2005-2010 (Ch1); 2 – the village of Chirikovo in 2018–2019 (Ch2); 3 – Paltsinsky Island, 2011 (Pal). Identified DNA mitotypes: GR 1 – B2, C1 *; GR 2 – A; GR 3 – C1
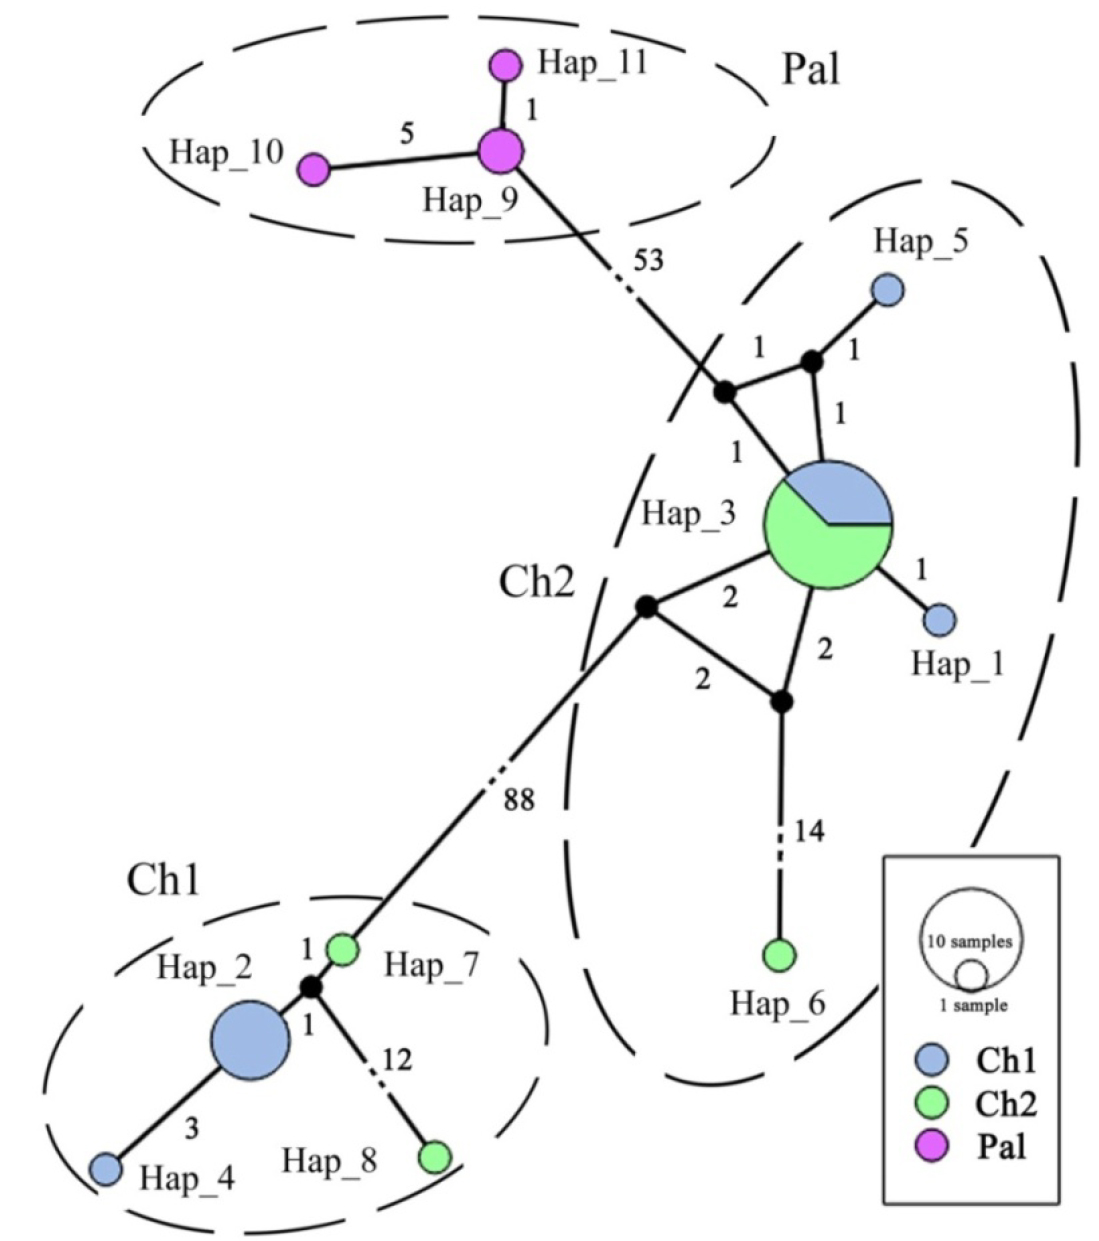
- Fig. 4. Results of genetic analysis of nucleotide sequences (n = 32) of the mtDNA region (D-loop, 1051 bp) of russet ground squirrels – the median network of haplotypes (Hap). The length of the branches connecting individual haplotypes is proportional to the number of mutational steps (indicated by numbers). Ch1 – population of the village of Chirikovo in the period of 2005–2010, Ch2 – population of the village of Chirikovo in the period of 2018–2019, Pal – population of Paltsinsky Island, 2011
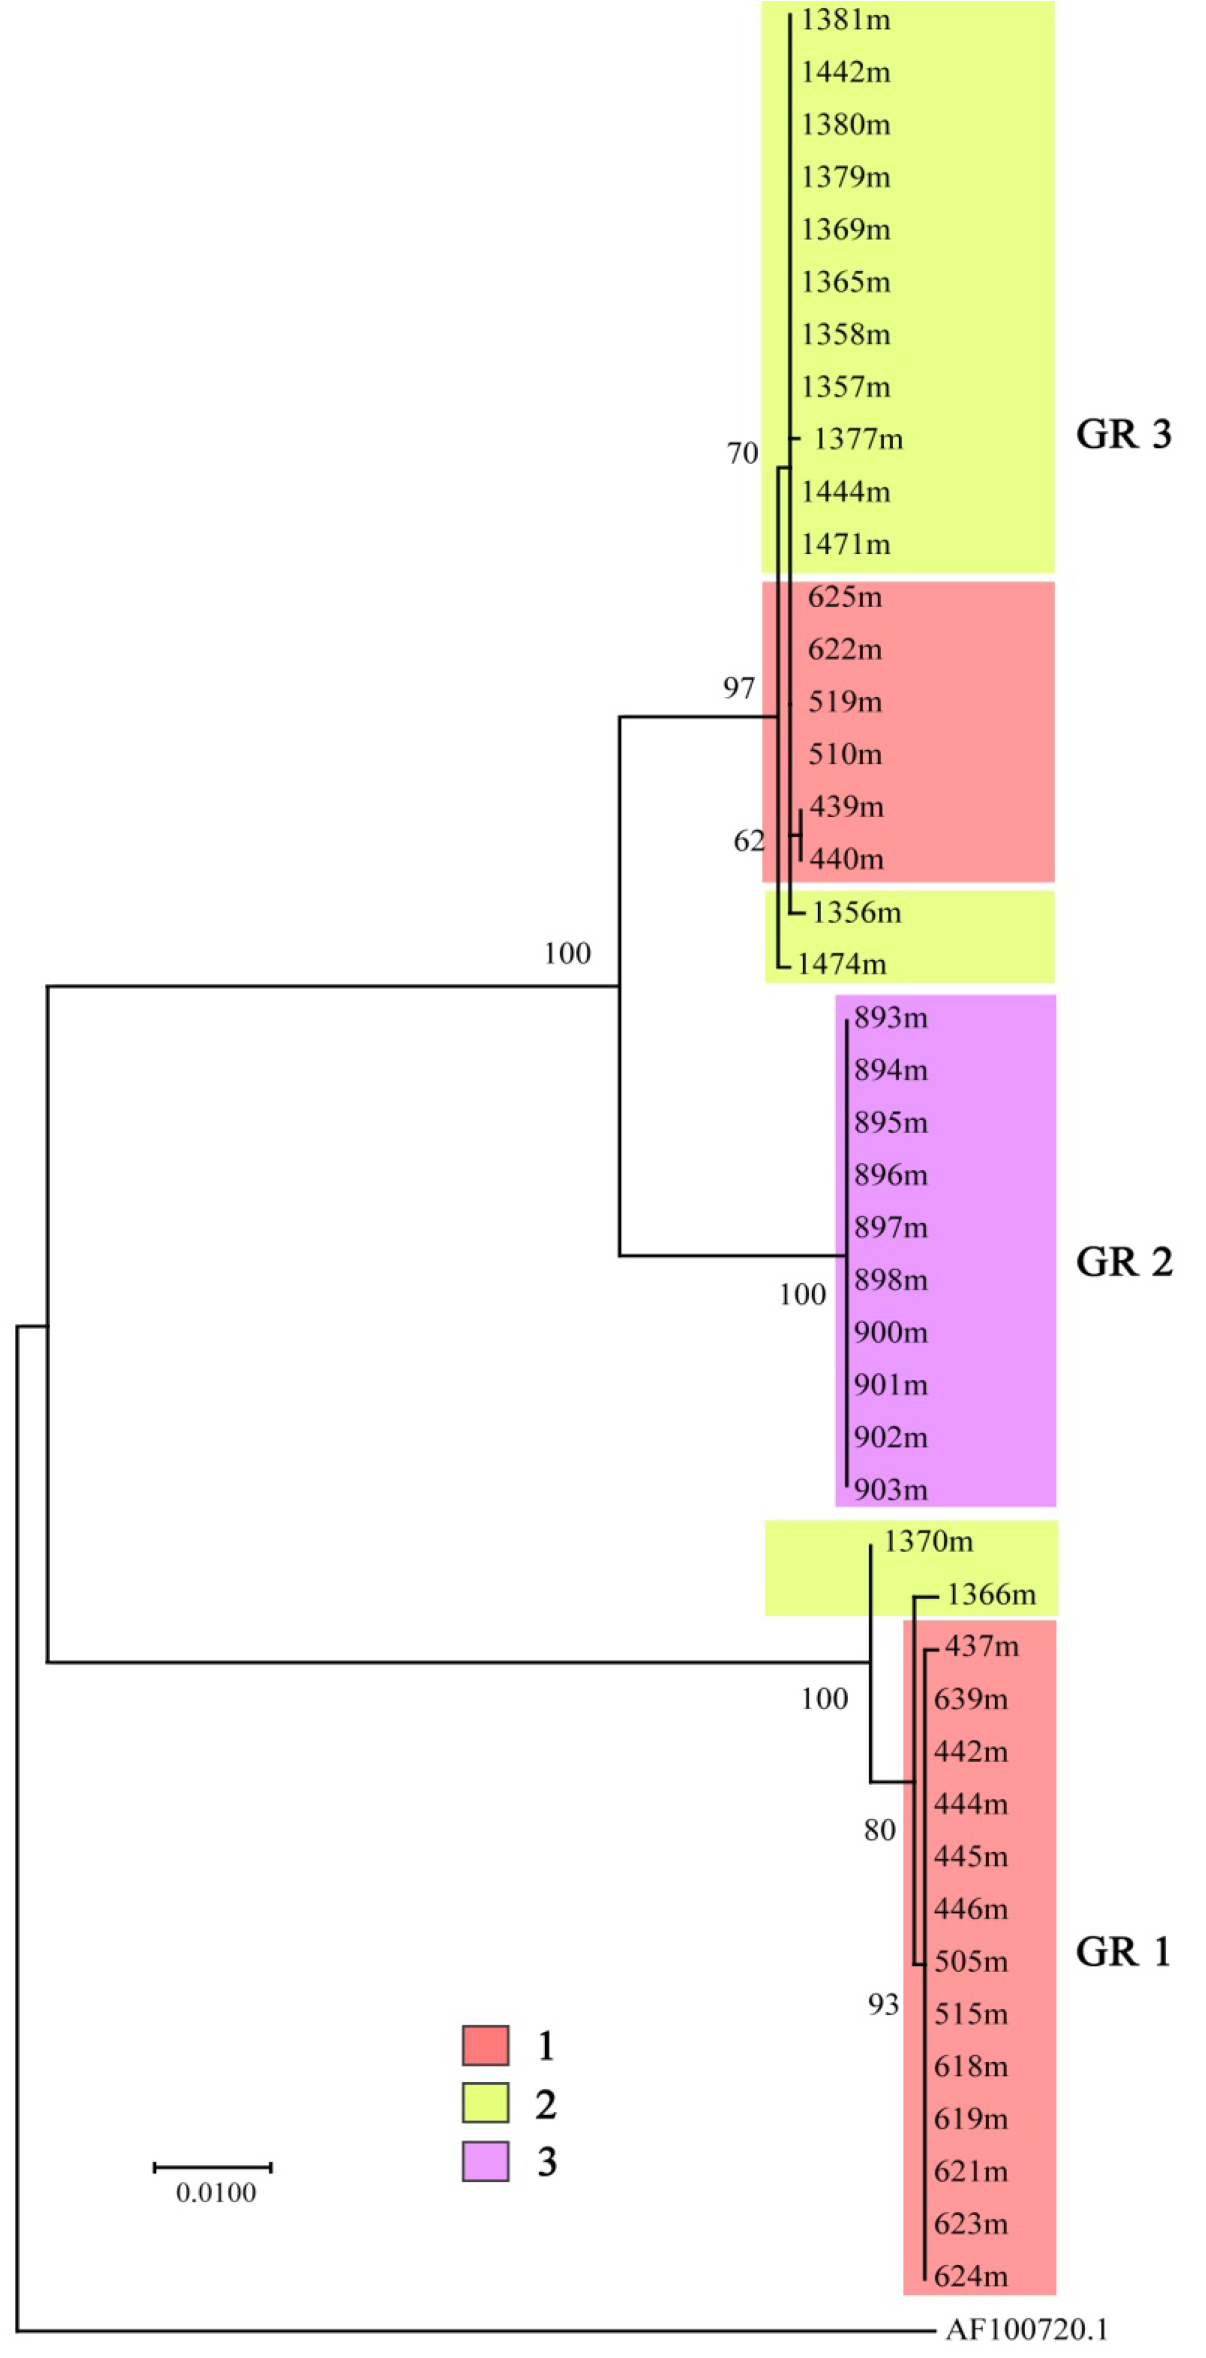
- Fig. 5. Results of genetic ML-analysis (model TN93 + G) of nucleotide sequences (n = 44) of the Cyt b gene of mtDNA (1140 bp), showing phylogenetic relationships between haplotypes characterizing model populations of the russet ground squirrel. In nodes – the results of the bootstrap analysis (1000 replicas), scale – genetic distances between mitotypes, outer group – Cyt b of the russet ground squirrel (AF100720.1). Populations: 1 – the village of Chirikovo in 2005-2010 (Ch1), 2 – the village of Chirikovo in 2018–2019 (Ch2), 3 – Paltsinsky Island, 2011 (Pal). IdentifiedmtDNAhaplogroups: GR 1, GR 2, GR 3
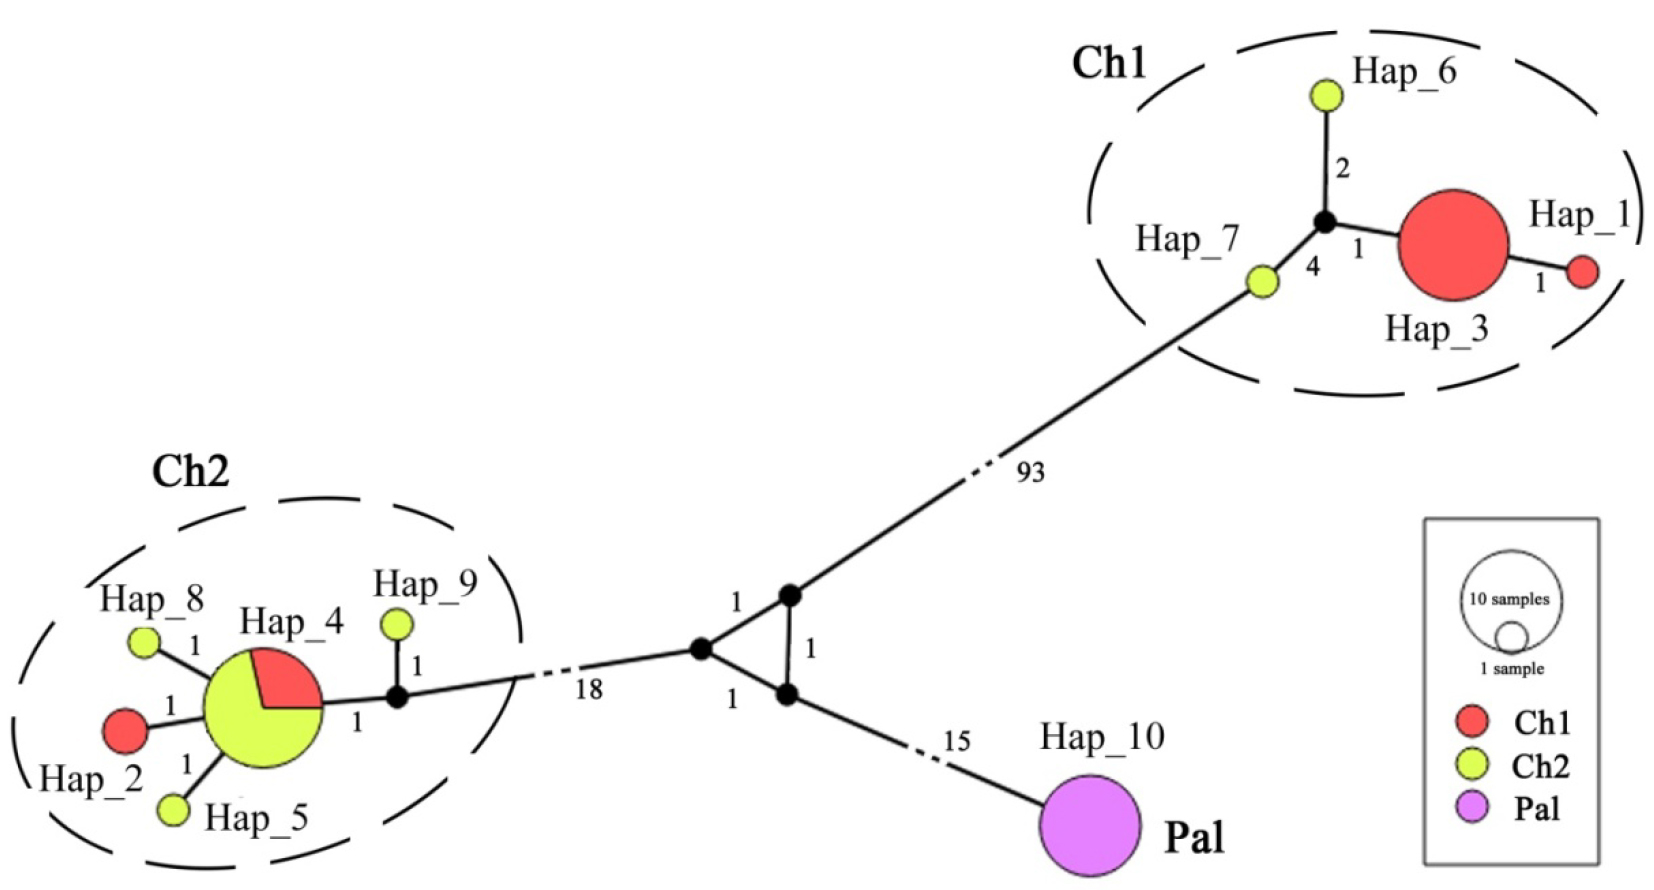
- Fig. 6. Results of genetic analysis of nucleotide sequences (n = 44) of the Cyt b gene (1140 bp) of the russet ground squirrel – median network of haplotypes (Hap). The length of the branches connecting individual haplotypes is proportional to the number of mutational steps (indicated by numbers). Ch1 – population of the village of Chirikovo in the period of 2005–2010, Ch2 – population of the village of Chirikovo in the period of 2018–2019, Pal – population of Paltsinsky Island, 2011
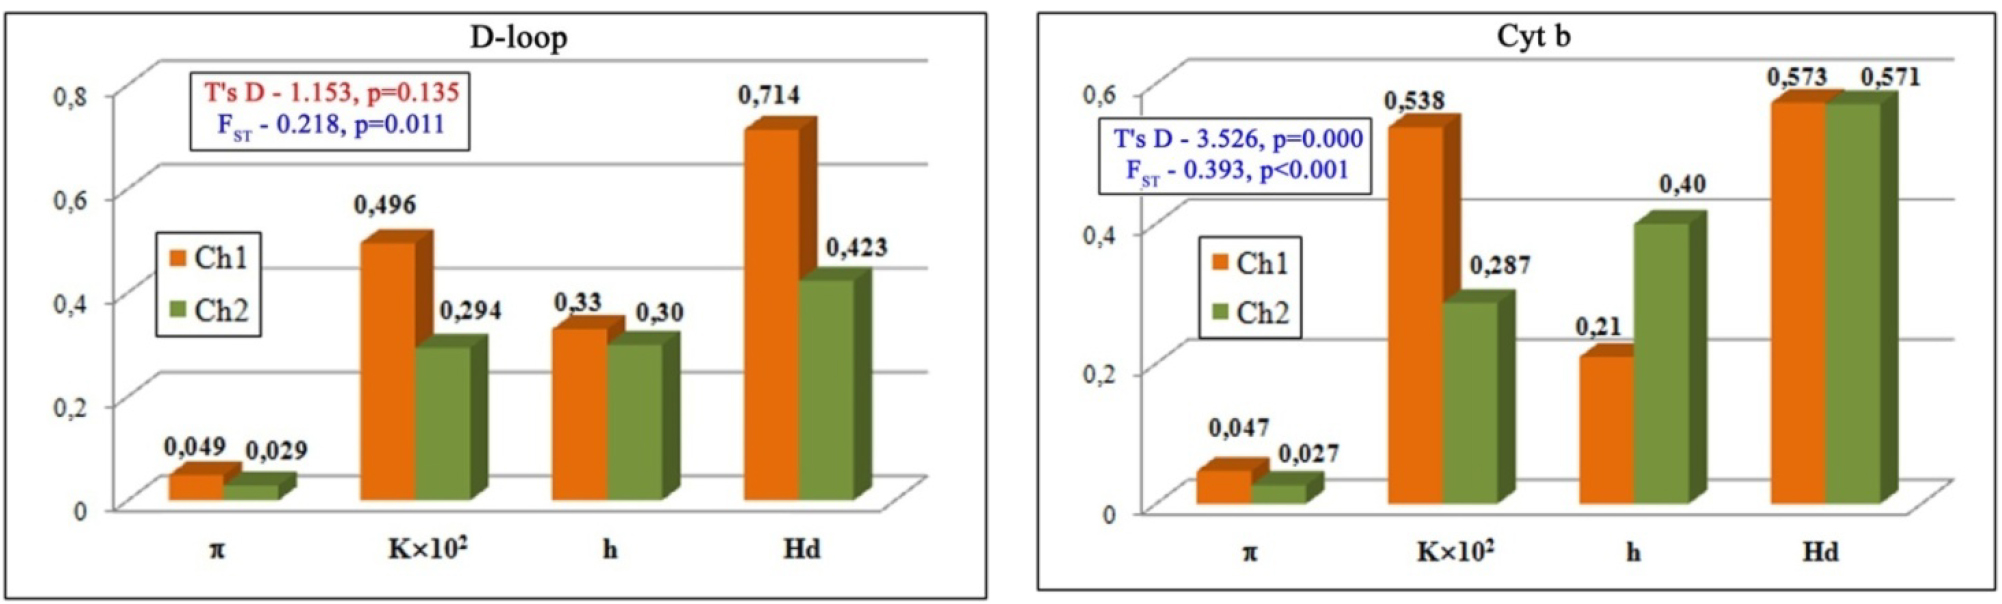
- Fig. 7. Comparison of indicators of genetic diversity (p, K, h, Hd) (DnaSP) and differentiations (T’s D, FST) (PopArt) of the russet ground squirrel population of the village of Chirikovo in the periods of 2005–2010 (Ch1) and 2018–2019 (Ch2) for two mtDNA markers – D-loop, Cyt b. Signs: p- nucleotide diversity, K – the average number of nucleotide differences (´102), h – the number of haplotypes, Hd – haplotype diversity, T’s D – Tajima’s test, FST – F-test