


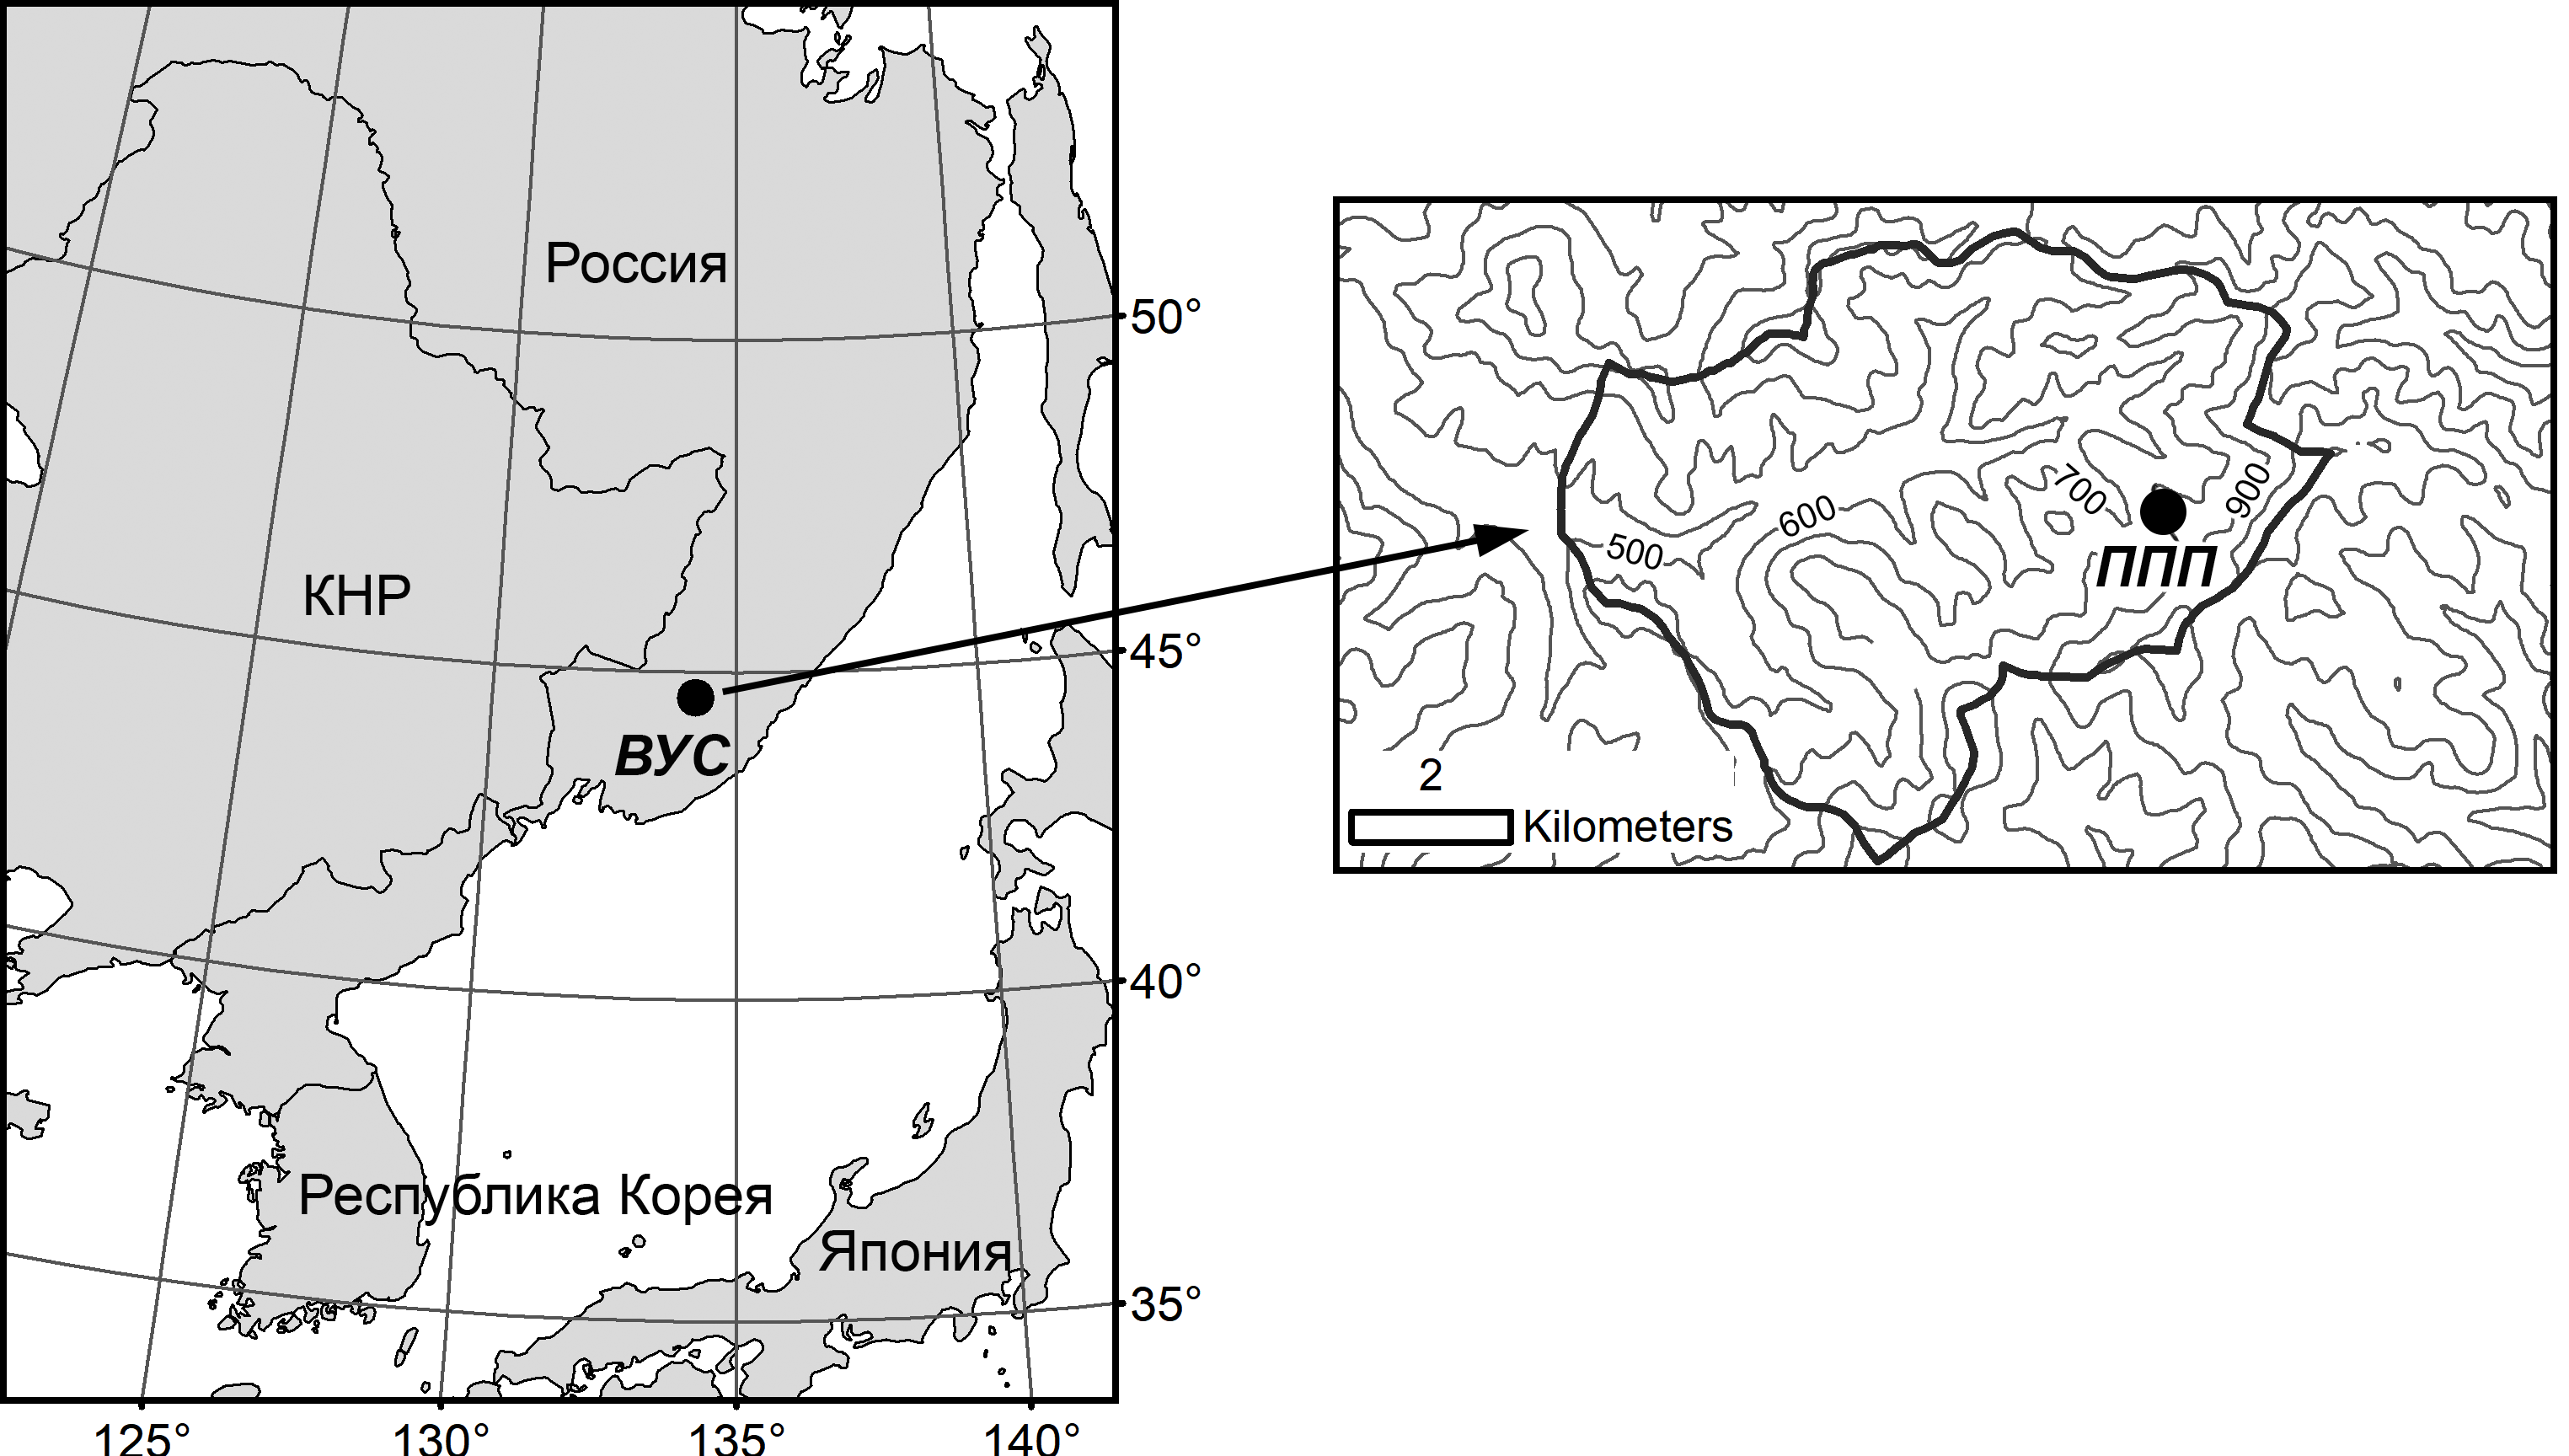
- Fig. 1. Location of the Verkhneussuriyskiy station of the Federal Research Center of Biodiversity FEB RAS (VUS) and permanent sample plots (PSP)
- Fig. 2. Location of Acer mono individuals on permanent sample plots: a – juvenile individuals; b – immature individuals (im1, im2, im3); c – virginal individuals (v1, v2); d – young generative individuals (v3, g1); e – middle and old age generative individuals (g2, g3)
- Fig. 3. Location of Acer ukurunduense individuals on permanent sample plots: a – juvenile individuals; b – immature individuals (im1, im2, im3); c – virginal individuals (v1, v2); d – young generative individuals (v3, g1); e – middle and old age generative individuals (g2, g3)
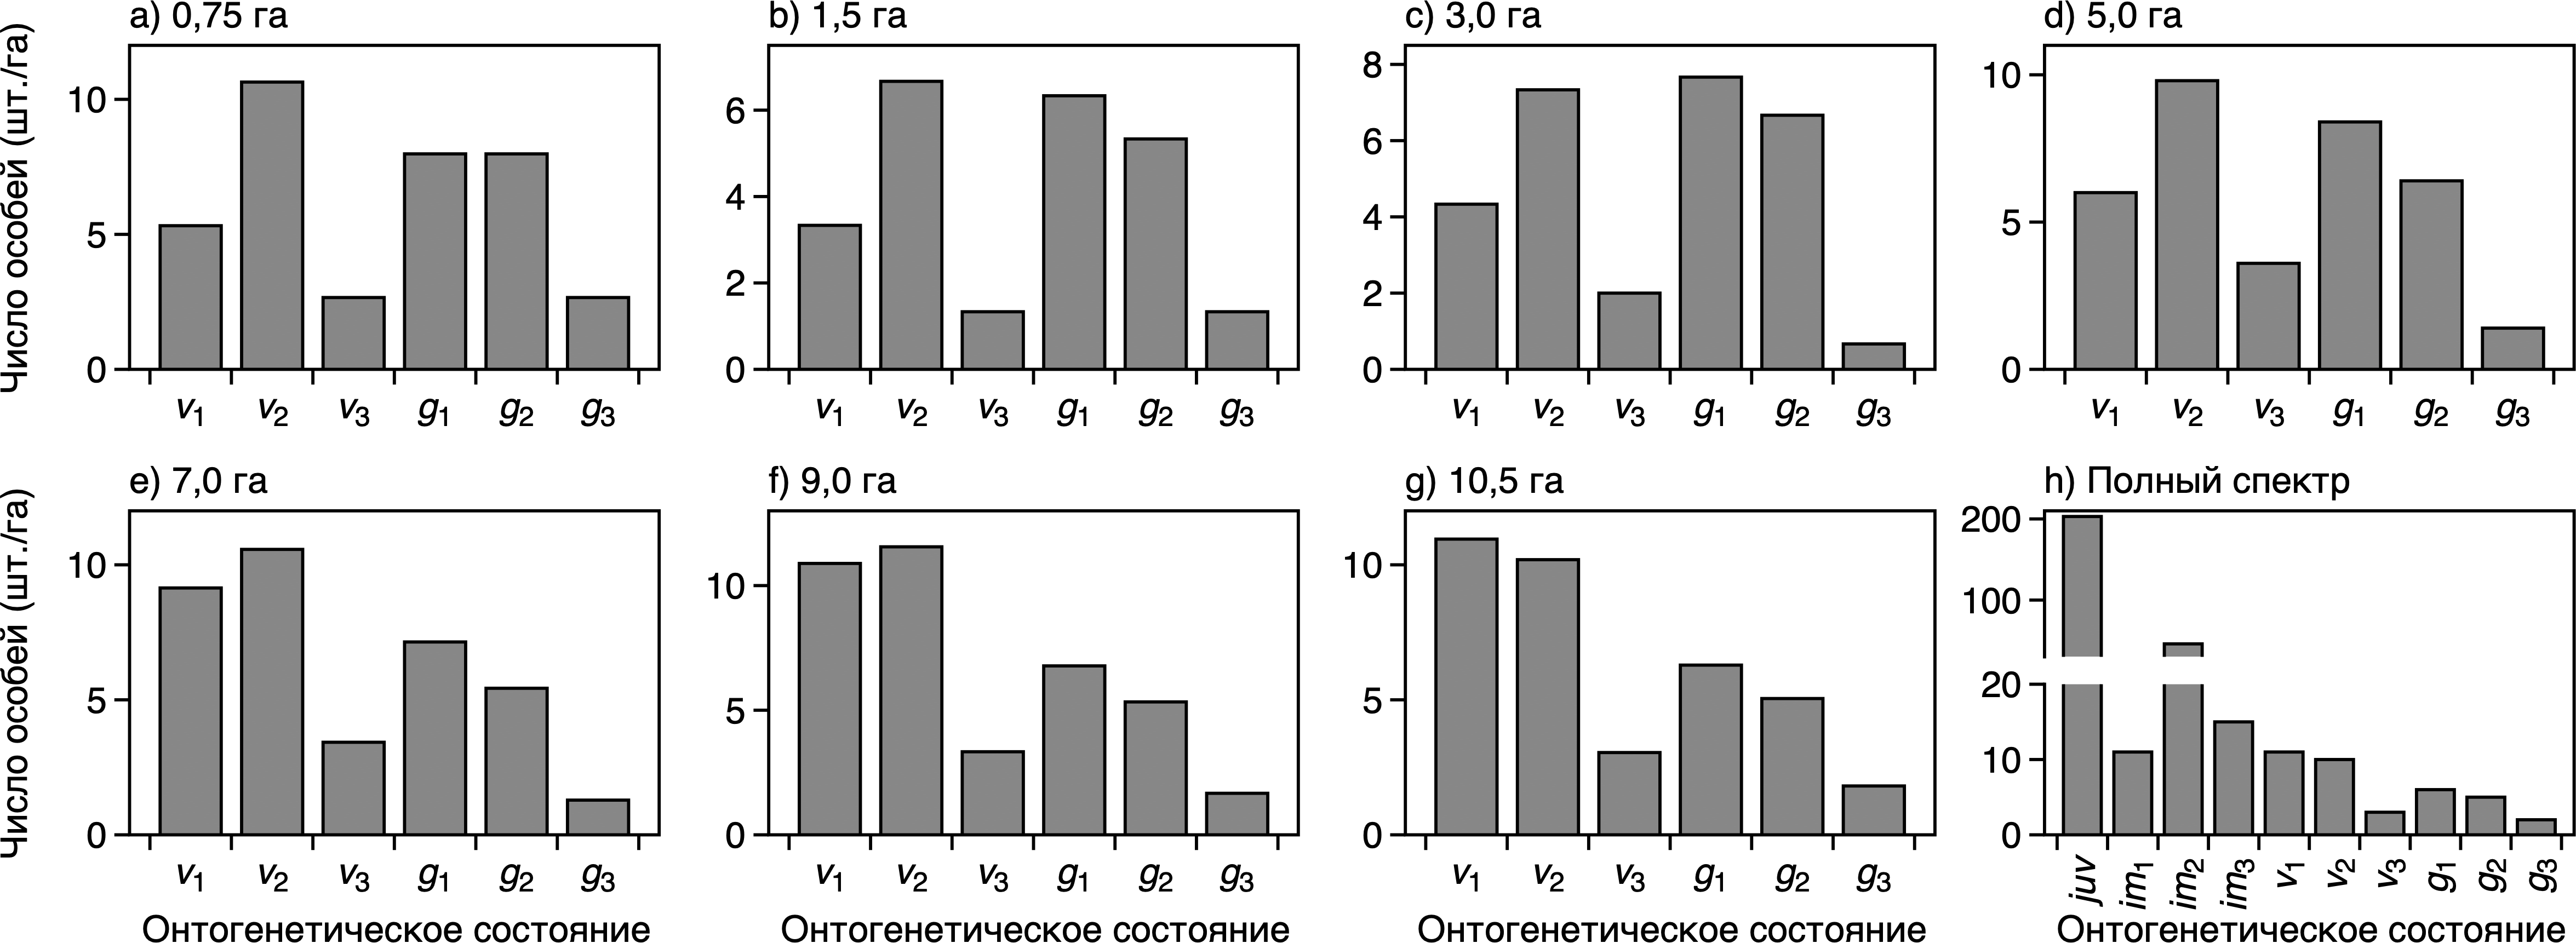
- Fig. 4. Change in the ontogenetic spectra of Acer mono with an increase in the analyzed area in terms of 1 ha (a – g) and the full spectrum obtained by combining data with PSP 71-2010 (juvenile and immature individuals) and PSP 72-2013 (virginal and generative individuals) (h)
- Fig. 5. Change in the ontogenetic spectra of Acer ukurunduense with an increase in the analyzed area in terms of 1 ha (a – g) and the full spectrum obtained by combining data with PSP 71-2010 (juvenile and immature individuals) and PSP 72-2013 (virginal and generative individuals) (h)
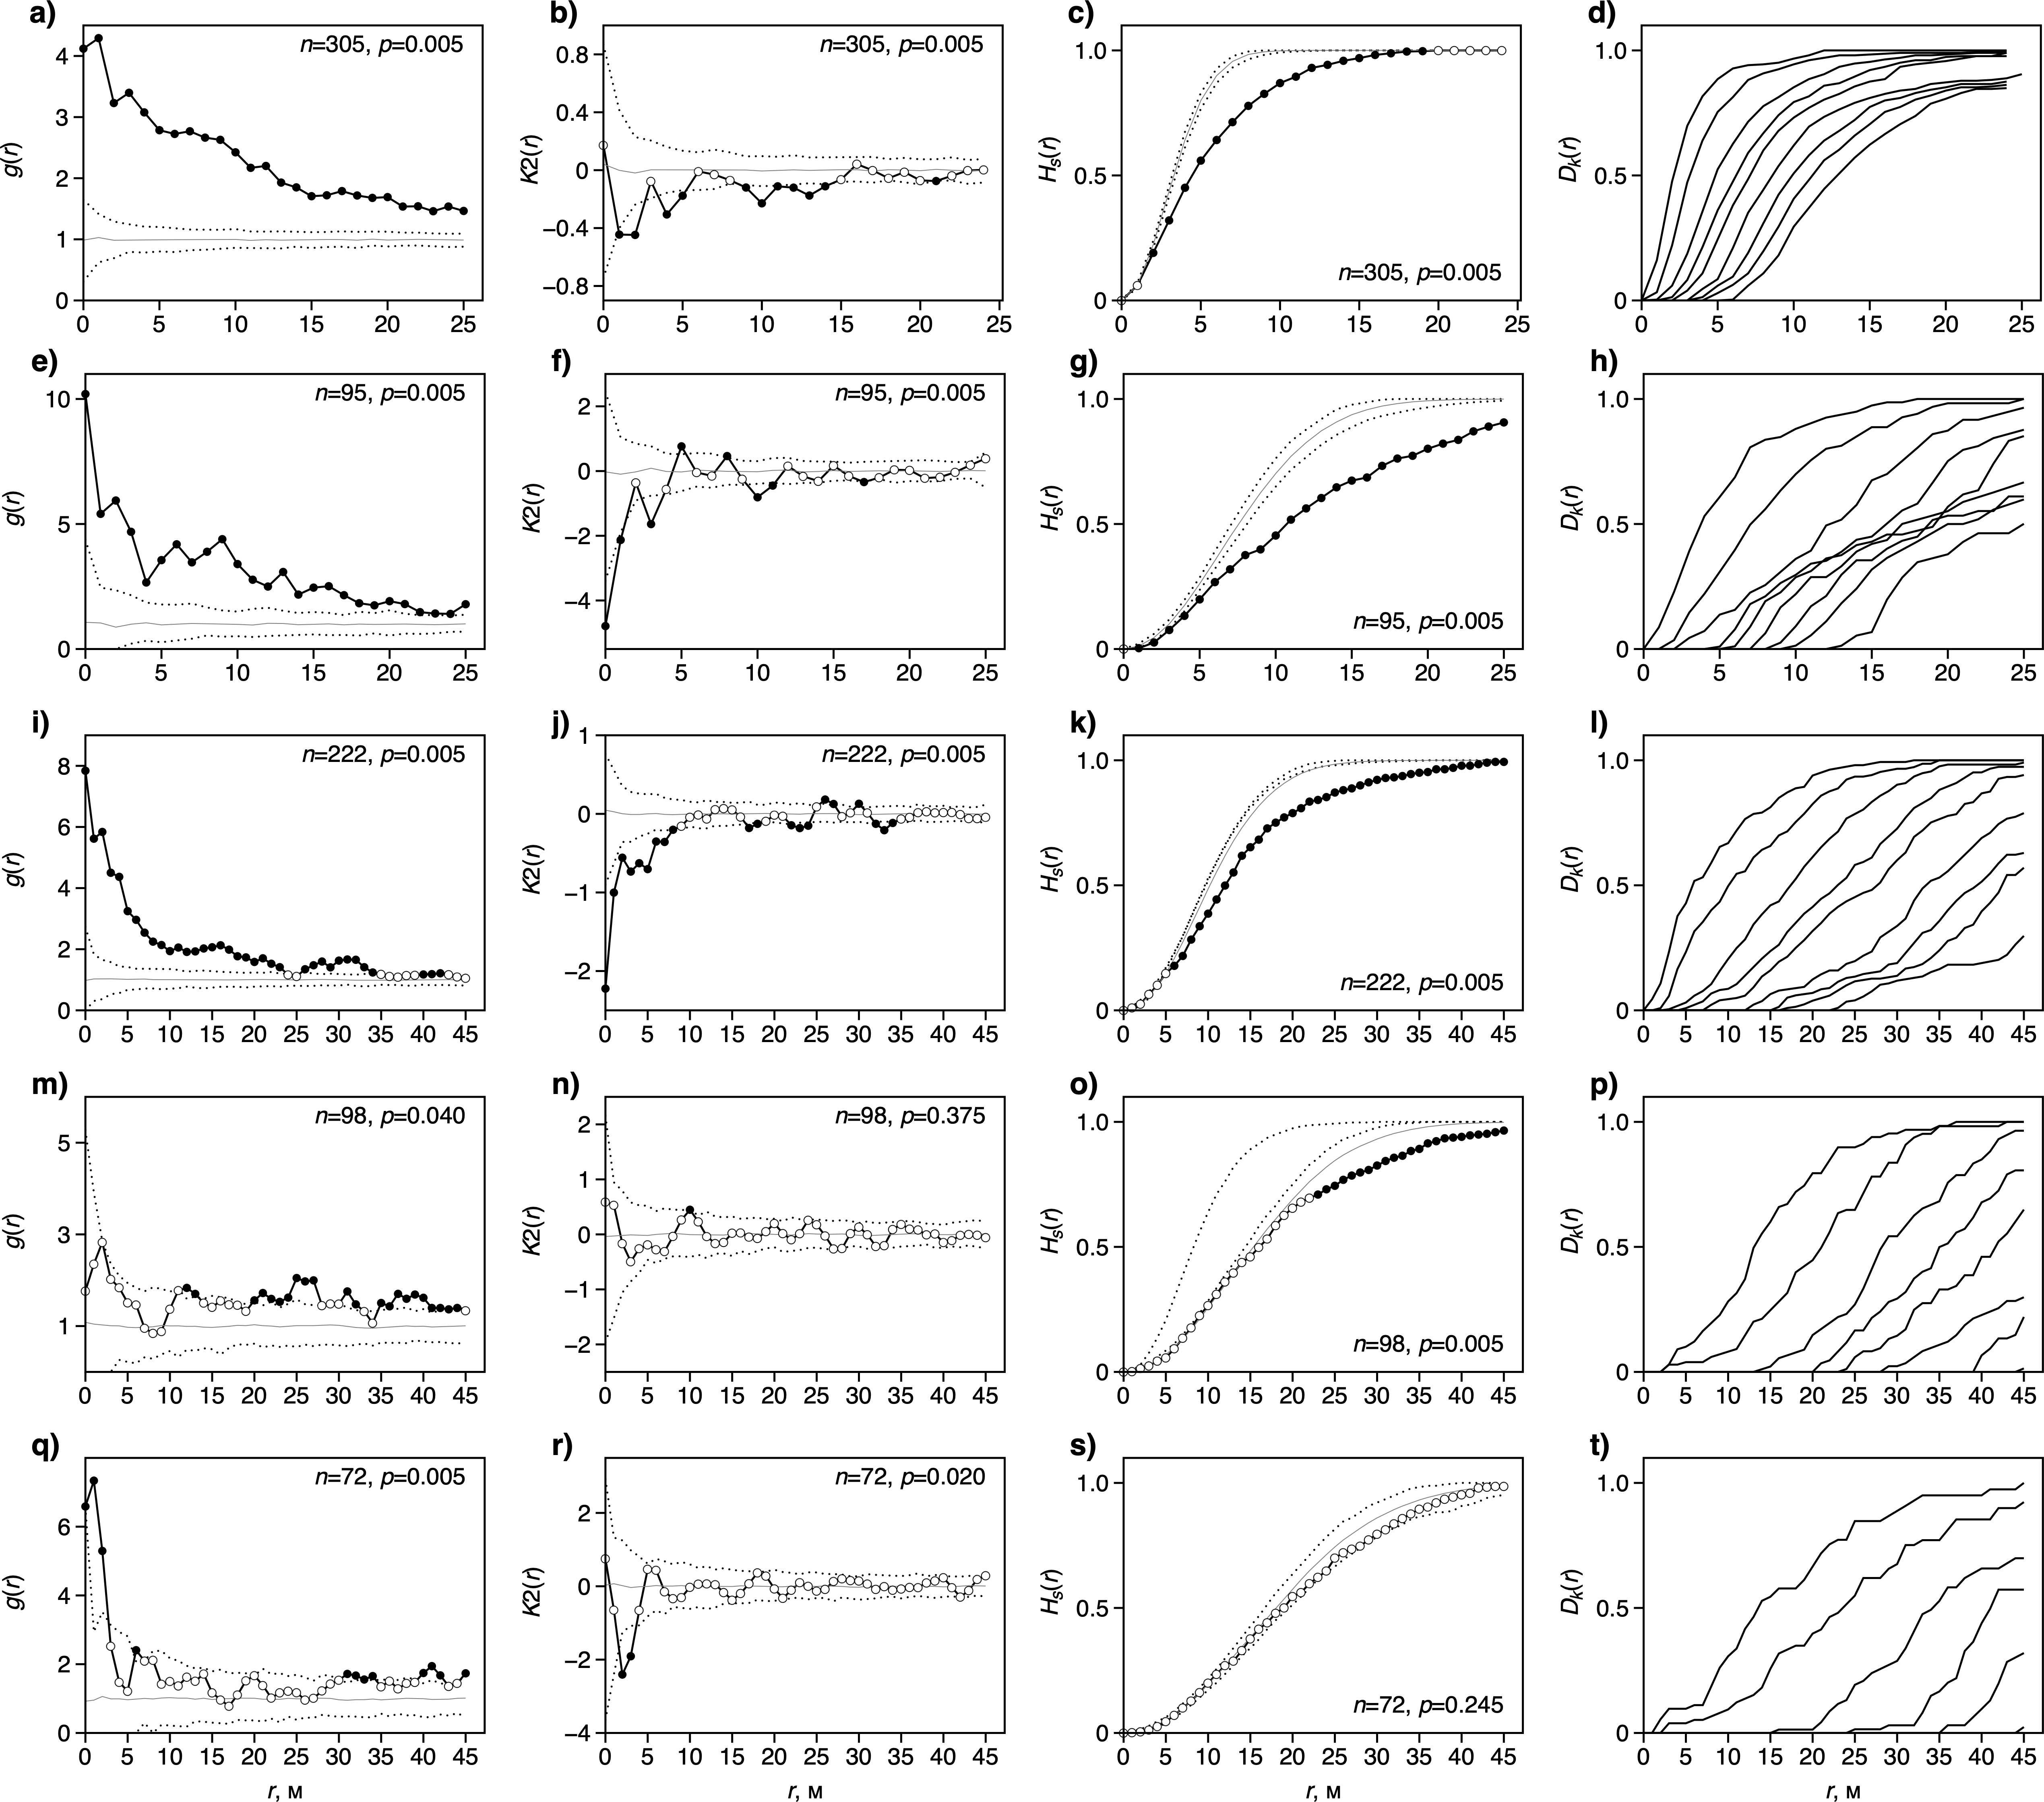
- Fig. 6. Characterics of the mosaic structure of Acer mono individuals using four statistical functions: a – d – juv; i – l – im1 + im2 + im3; m – p – v1 + v2; q – t – v3 + g1; e – g2 + g3; n is the number of individuals in the mosaic; p – p-level according to the results of the GoF-test. Solid line is an empirical curve, dashed line – expected value according to the null model, white dots – values within the simulation intervals, black dots – values outside the simulation intervals
- Fig. 7. Characteristics of the mosaic structure of Acer ukurunduense individuals using four statistical functions: a – d – juv; i – l – im1 + im2 + im3; m – p – v1 + v2; q – t – v3 + g1; e – g2 + g3; n – number of individuals in a mosaic; p – p-level according to the results of the GoF-test. Solid line – empirical curve, dashed line – expected value according to the null model, white dots – values within the simulation intervals, black dots – values outside the simulation intervals
- Fig. 8. Change in the number of connections of Acer mono (a) and Acer ukurunduense (b) with other tree species in the process of ontogenetic development of individuals: n / s – statistically insignificant connections, neg. – negative connections, pos. – positive connections
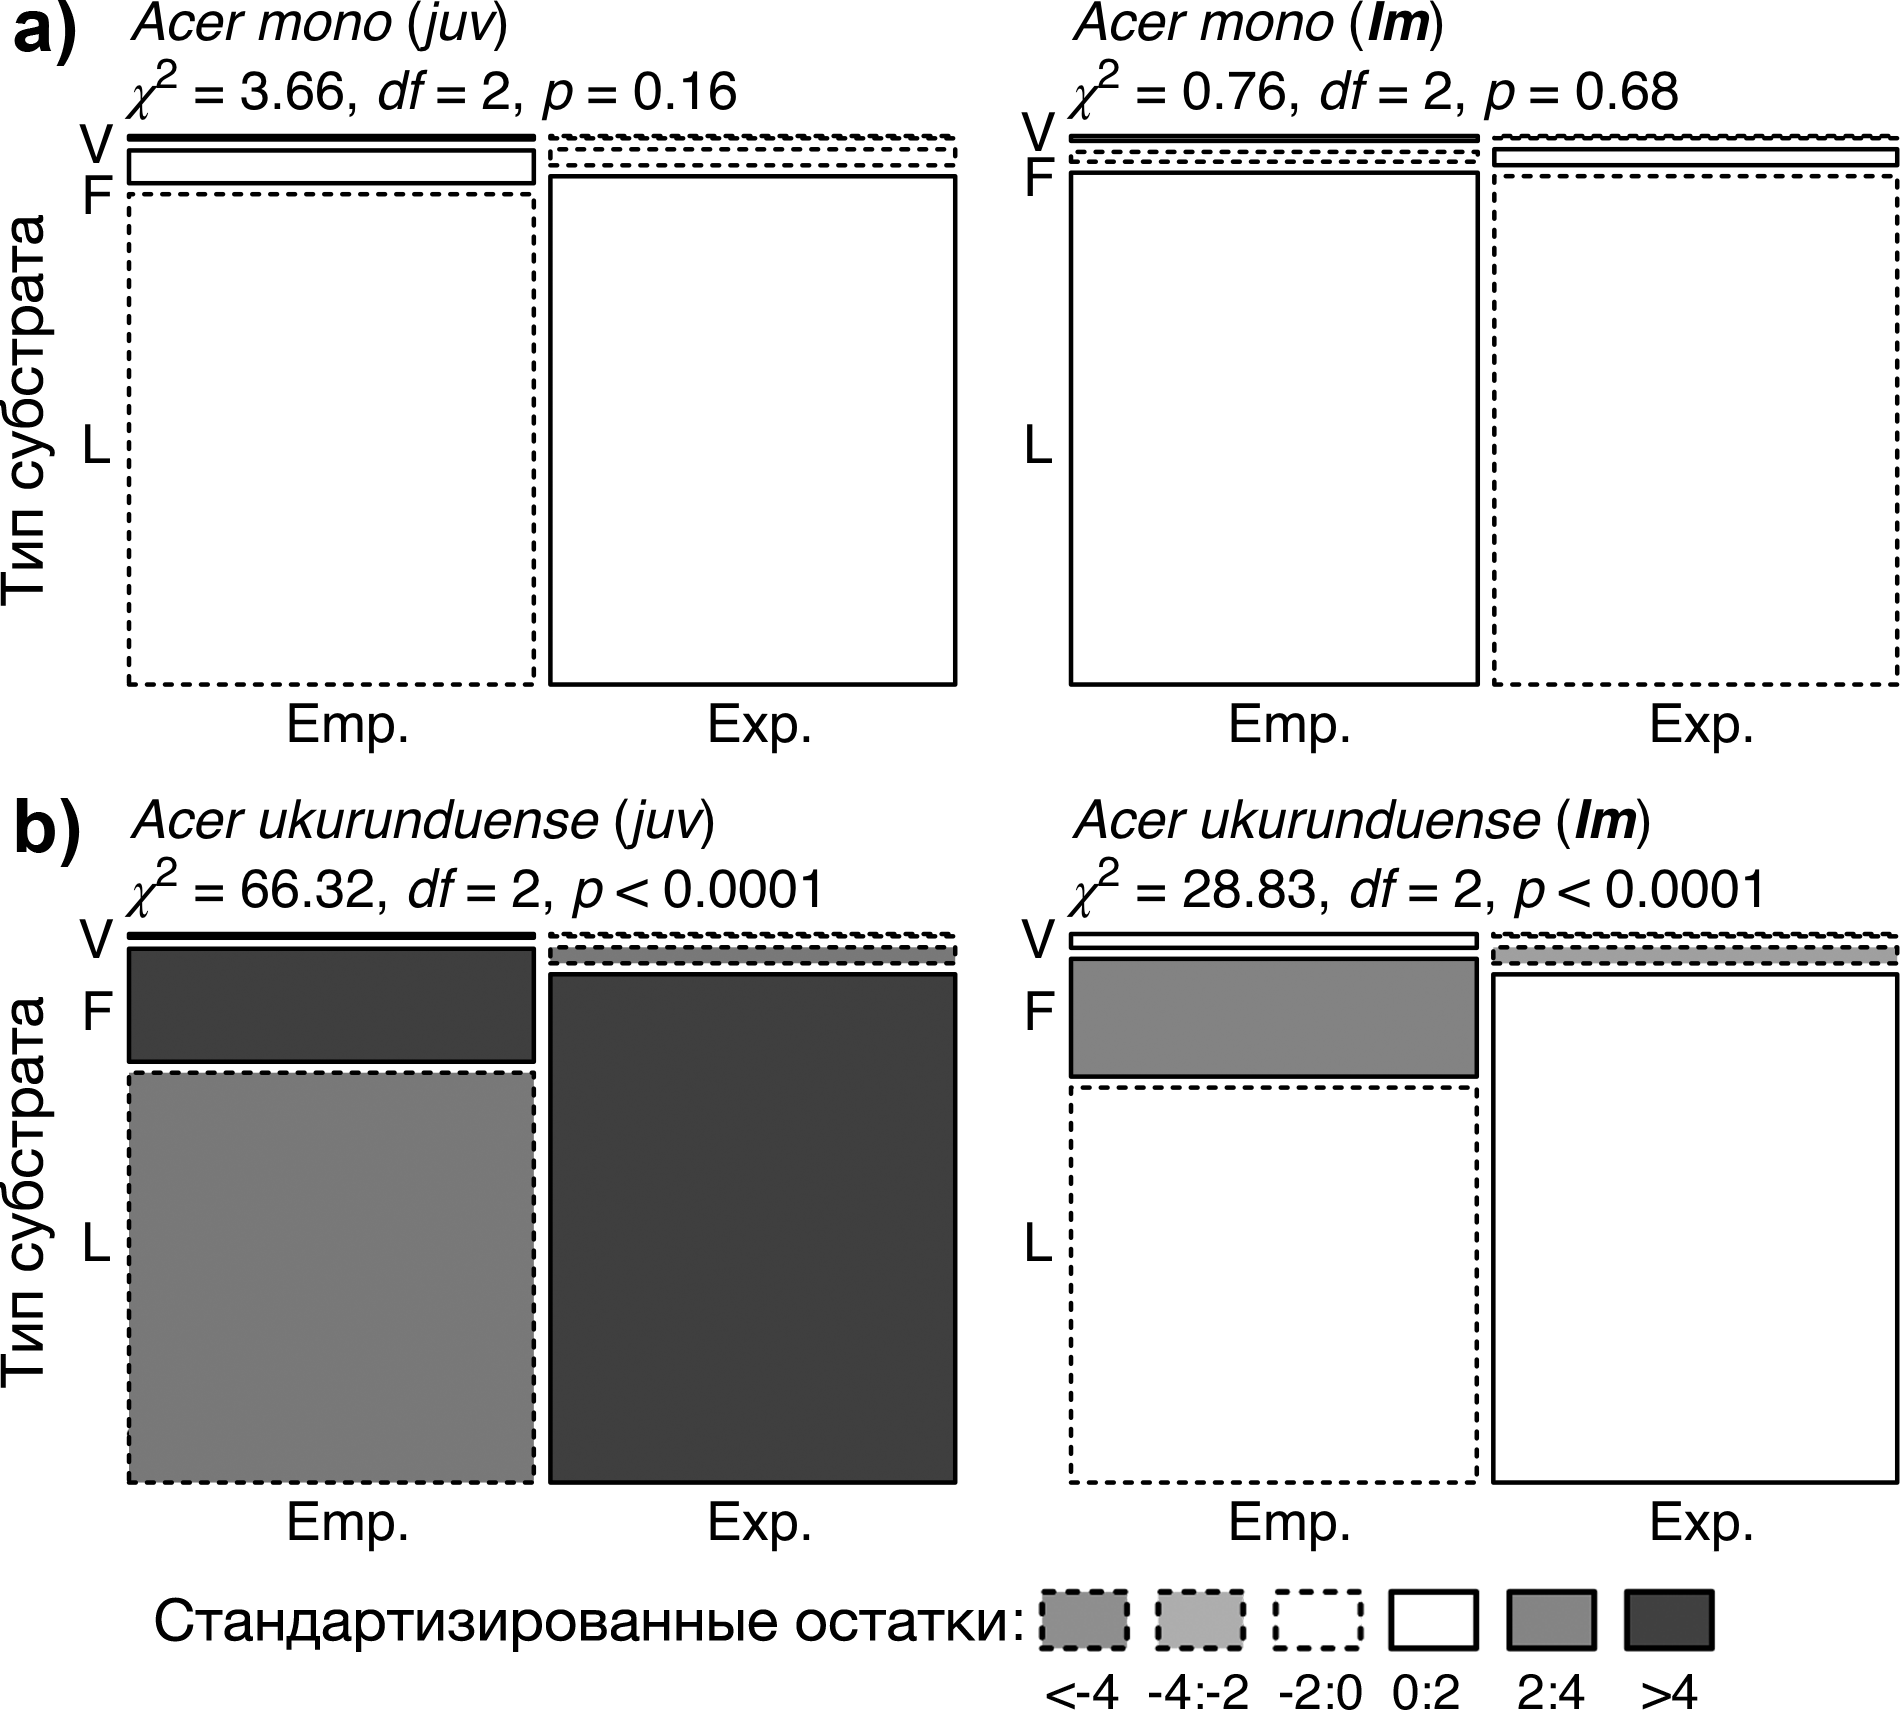
- Fig. 9. Observable and expected frequencies of juvenile (juv) and immature (Im – im1 + im2 + im3) individuals of Acer mono (a) and Acer ukurunduense (b) on different types of substrate: L – leaf litter, F – semi-decomposed deadwood and stumps, V – wind-soil complex. Area of each rectangle is proportional to the cell frequency of the corresponding contingency table. Solid and dashed lines indicate positive and negative deviation from the expected frequencies. The color of the rectangle corresponds to the standardized residuals (values are shown in the legend). Light gray and dark gray rectangles show significant deviations from the expected frequencies (for a = 0,005 and a = 0,0001, respectively)
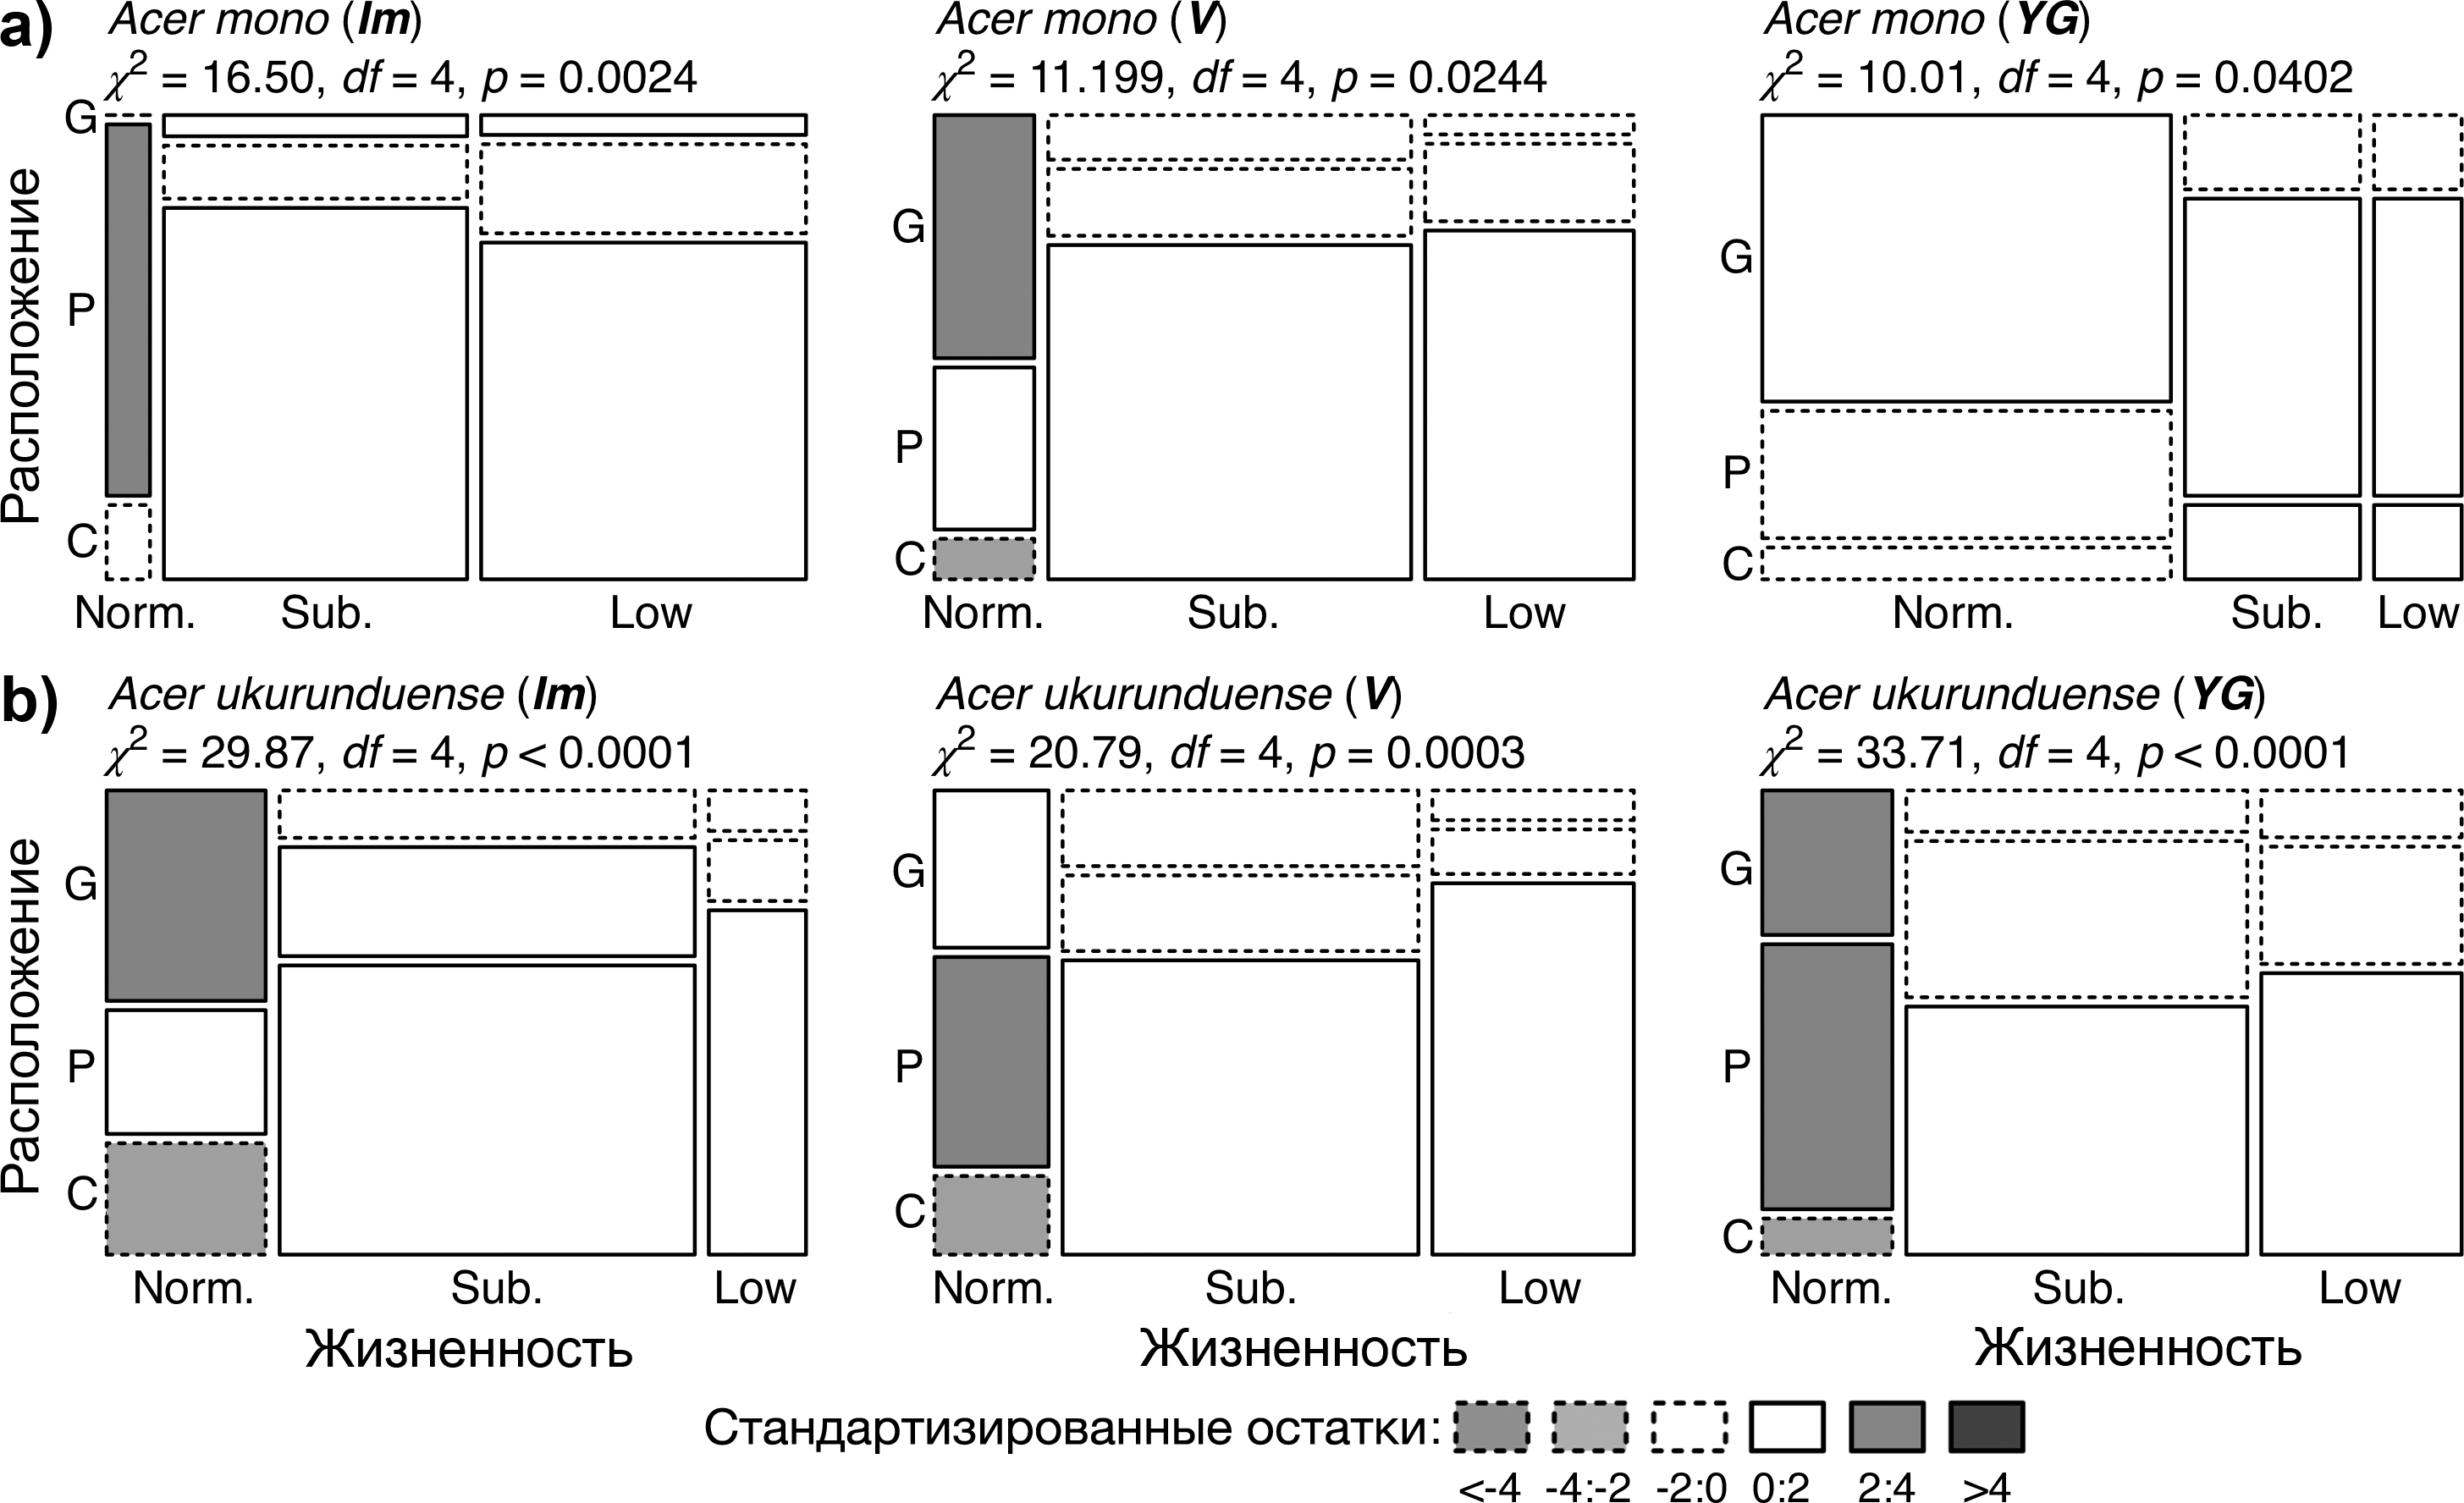
- Fig. 10. Observed frequencies of individuals of normal, lower and low vitality depending on their location relative to the canopy and gaps: Im – immature (im1 + im2 + im3), V – virginal (v1 + v2), YG – young generative (v3 + v1). Positions: G – in the gap, P – at the periphery of the gap, C – under the canopy; vitality: Norm. – normal, Sub. – lower, Low – low. The area of each rectangle is proportional to the cell frequency of the corresponding contingency table. Solid and dashed lines represent positive and negative deviations from the expected frequencies. The color of the rectangle corresponds to the standardized residuals (values are shown in the legend). Light gray and dark gray rectangles show significant deviations from the expected frequencies (at a = 0,005 and a = 0,0001, respectively)
Copyright © 2016 RJEE. THE ONLINE EDITION IS REGISTERED IN THE FEDERAL SERVICE FOR SUPERVISION OF COMMUNICATIONS, INFORMATION TECHNOLOGY, AND MASS MEDIA. REGISTRATION CERTIFICATE № FS 77 – 62950 from 04.09.2015.